Introduction
| Price | Cores | Clock | |
| Intel Core i7-2600k | $339 | 4 | 3.4 GHz |
| Intel Core i5-2380p | $194 | 4 | 3.1 GHz |
| Intel Core i3-2130 | $129 | 2 | 3.4 GHz |
| AMD FX-8350 | $199 | 8 | 4.0 GHz |
| AMD FX-8150 | $174 | 8 | 3.6 GHz |
| AMD FX-6350 | $139 | 6 | 3.9 GHz |
| AMD FX-4350 | $119 | 4 | 4.2 GHz |
| AMD A10-6800K | $139 | 4 | 4.1 GHz |
| AMD A10-6700 | $129 | 4 | 3.7 GHz |
| AMD A10-5800K | $129 | 4 | 3.8 GHz |
It's a wide, wide processing world out there. A whole host of processing options are now available on the market. They run the gamut of extremes between high efficiency and high power. More and more are coming with built-in graphics, and those graphic options are now actually usable.
Modern processors contain from 2-8 processing cores, with speeds ranging from 3.1GHz to 4.2GHz. This wide range of options creates a lot of price posts, with mainstream prices ranging from $120 to $350.
This mix of cores and speed produces a wide range of performance ratings in CPU-intensive tasks, but how does that translate to gaming which is more GPU dependent? Is a high-end processor even needed for gaming?
Should you save money on a CPU purchase, and instead put that towards a better (or possibly 2nd) GPU? Or should that money go to better equipment such as an SSD, higher quality input devices, or additional monitors for Surround/Eyefinity?
These are the questions we hope to answer here.
CPU Power
| Geekbench 3 | Cinebench 11 | |||||||||||
| 32-bit | 64-bit | 32-bit | 64-bit | |||||||||
| Single | Multi | Single | Multi | Single | Multi | Single | Multi | |||||
| Intel Core i7-2600k | 3133 | 11826 | 3275 | 12287 | 1.37 | 6.43 | 1.52 | 6.88 | ||||
| Intel Core i5-2380p | 2915 | 8994 | 3005 | 9466 | 1.23 | 4.58 | 1.36 | 5.07 | ||||
| Intel Core i3-2130 | 2707 | 5734 | 2818 | 5941 | 1.21 | 3.04 | 1.33 | 3.24 | ||||
| AMD FX-8350 | 2215 | 11820 | 2448 | 12752 | 1.03 | 6.60 | 1.10 | 6.86 | ||||
| AMD FX-8150 | 2106 | 10285 | 2282 | 10947 | 0.94 | 5.66 | 1.01 | 5.95 | ||||
| AMD FX-6350 | 2205 | 8905 | 2461 | 9733 | 1.02 | 4.79 | 1.09 | 5.01 | ||||
| AMD FX-4350 | 2256 | 6642 | 2529 | 7273 | 1.04 | 3.43 | 1.11 | 3.56 | ||||
| AMD A10-6800K | 2240 | 6458 | 2509 | 7066 | 1.06 | 3.40 | 1.13 | 3.53 | ||||
| AMD A10-6700 | 2208 | 6260 | 2455 | 6827 | 1.03 | 3.16 | 1.10 | 3.32 | ||||
| AMD A10-5800K | 2141 | 6109 | 2409 | 6650 | 1.00 | 3.13 | 1.07 | 3.27 | ||||
To compare the processing capabilities of each chip, I tested them with GeekBench 3, and CineBench 11. We tested each in 32-bit and 64-bit modes. The data presented here shows the results for both single core and multi core performance.
Looking at the single core GeekBench results, you can see performance improvements between generations and/or series. For example, there is a noticeable improvement between the AMD FX-8150 and the FX-8350. However, the results between the FX-4350, FX-6350 and FX-8350 are similar.
We see similar single core results with the AMD APUs. There is a measurable difference between the A10-5800K and the A10-6800K, while the performance between the A10-6700 and the A10-6800K are similar.
Conversely there is significant single core performance increase between the Core i3, Core i5 and Core i7.
Comparing the single core and multi-core numbers allows us to understand how efficiently the chips multiply their performance across the whole die. The main comparison is to look at the multi-core performance between the chips, which allows us to compare overall processing performance.
Finally we look at the performance versus price. Bigger chips give us better performance, but are they worth the price premium? The APUs show a slow stead performance improvement, with little change in price.
The AMD FX chips show a rapid performance improvement, with relatively small price increases. The FX-6350 provides ~50% performance improvement over the A10-5800K and A10-6700, with only a $20 increase in price. The FX-8350 almost doubles the performance of these chips, with a ~50% increase in price.
The Core i3-2130 prices right along with the AMD APUs, but the performance is much lower. The Core i5-2380p comes in at just under the FX-6350, but prices at 50% higher. The Core i7-2600k performs just under the FX-8350, but costs 70% more.
From a price/performance perspective, the AMD FX chips provide the best value. But the question still remains on how CPU performance actually translated into improved gaming performance.

Benchmarking
This project was weeks in the testing. I tested each of the 10 processors, across three games, each of those three GPUs, in both 1080p HD and Eyefinity 3x 1080p HD. This results in a ton of tests - 180 to be exact (10 x 3 x 3 x 2).
Each CPU was tested at stock clock speeds, with 8GB of RAM in Dual-Channel configuration. The GPUs were also run at stock clock speed.
PLEASE NOTE: When I started this testing, I tested on the Radeon HD 7790, Radeon HD 7870 GHz and Radeon HD 7970 GHz. In my final days of testing, AMD re-branded and relaunched these cards as the Radeon R7 260X, R9 270X and the R9 280X. This article we published three weeks ago confirms that the new cards perform identically to old cards.
Based on this finding, we are using the new branding and pricing for the article. This allows us to provide information to users on current products, and allows us to use current market pricing in our analysis.
Metro Last Light
For Metro Last Light I used the be built-in benchmarking tool. The test was run at "Very High" quality, with AF 16X texture filtering, Low motion blur and Normal tessellation.
The standard settings on the benchmark run for three loops. I used FRAPS to capture the performance data of the third and last loop.
| Metro Last Light - 1080p HD | Metro Last Light - 1080p Eyefinity | |||||||||||||||||||||||
| R7 260X | R9 270X | R9 280X | R7 260X | R9 270X | R9 280X | |||||||||||||||||||
| Min | Avg | Max | Min | Avg | Max | Min | Avg | Max | Min | Avg | Max | Min | Avg | Max | Min | Avg | Max | |||||||
| Intel Core i7-2600k | 17 | 27.3 | 43 | 25 | 36.9 | 60 | 33 | 53.6 | 87 | 7 | 11.1 | 16 | 10 | 15.3 | 22 | 16 | 24.1 | 36 | ||||||
| Intel Core i5-2380p | 17 | 27.2 | 43 | 24 | 36.8 | 60 | 33 | 53.4 | 86 | 7 | 11.0 | 16 | 9 | 15.3 | 22 | 15 | 24.1 | 36 | ||||||
| Intel Core i3-2130 | 18 | 27.1 | 43 | 24 | 36.1 | 57 | 22 | 49.1 | 75 | 7 | 11.0 | 16 | 10 | 15.2 | 22 | 17 | 24.2 | 36 | ||||||
| AMD FX-8350 | 18 | 27.1 | 43 | 25 | 36.9 | 60 | 34 | 53.0 | 84 | 7 | 11.1 | 16 | 10 | 15.3 | 22 | 16 | 24.1 | 36 | ||||||
| AMD FX-8150 | 18 | 27.0 | 42 | 25 | 36.9 | 60 | 29 | 52.6 | 80 | 7 | 11.0 | 16 | 10 | 15.3 | 22 | 16 | 24.2 | 36 | ||||||
| AMD FX-6350 | 17 | 27.0 | 43 | 25 | 36.9 | 60 | 29 | 52.5 | 82 | 7 | 11.0 | 16 | 9 | 15.3 | 22 | 16 | 24.2 | 36 | ||||||
| AMD FX-4350 | 18 | 27.1 | 43 | 23 | 36.1 | 59 | 23 | 49.5 | 75 | 8 | 11.0 | 16 | 10 | 15.3 | 22 | 16 | 23.8 | 35 | ||||||
| AMD A10-6800K | 18 | 26.8 | 43 | 20 | 35.7 | 55 | 21 | 43.5 | 67 | 7 | 11.0 | 16 | 9 | 15.2 | 22 | 16 | 23.8 | 35 | ||||||
| AMD A10-6700 | 17 | 26.7 | 42 | 17 | 35.1 | 53 | 20 | 42.0 | 65 | 7 | 10.9 | 16 | 9 | 15.2 | 22 | 15 | 23.8 | 35 | ||||||
| AMD A10-5800K | 16 | 26.6 | 43 | 14 | 34.5 | 51 | 18 | 40.9 | 63 | 7 | 11.0 | 16 | 10 | 15.1 | 22 | 14 | 23.6 | 35 | ||||||
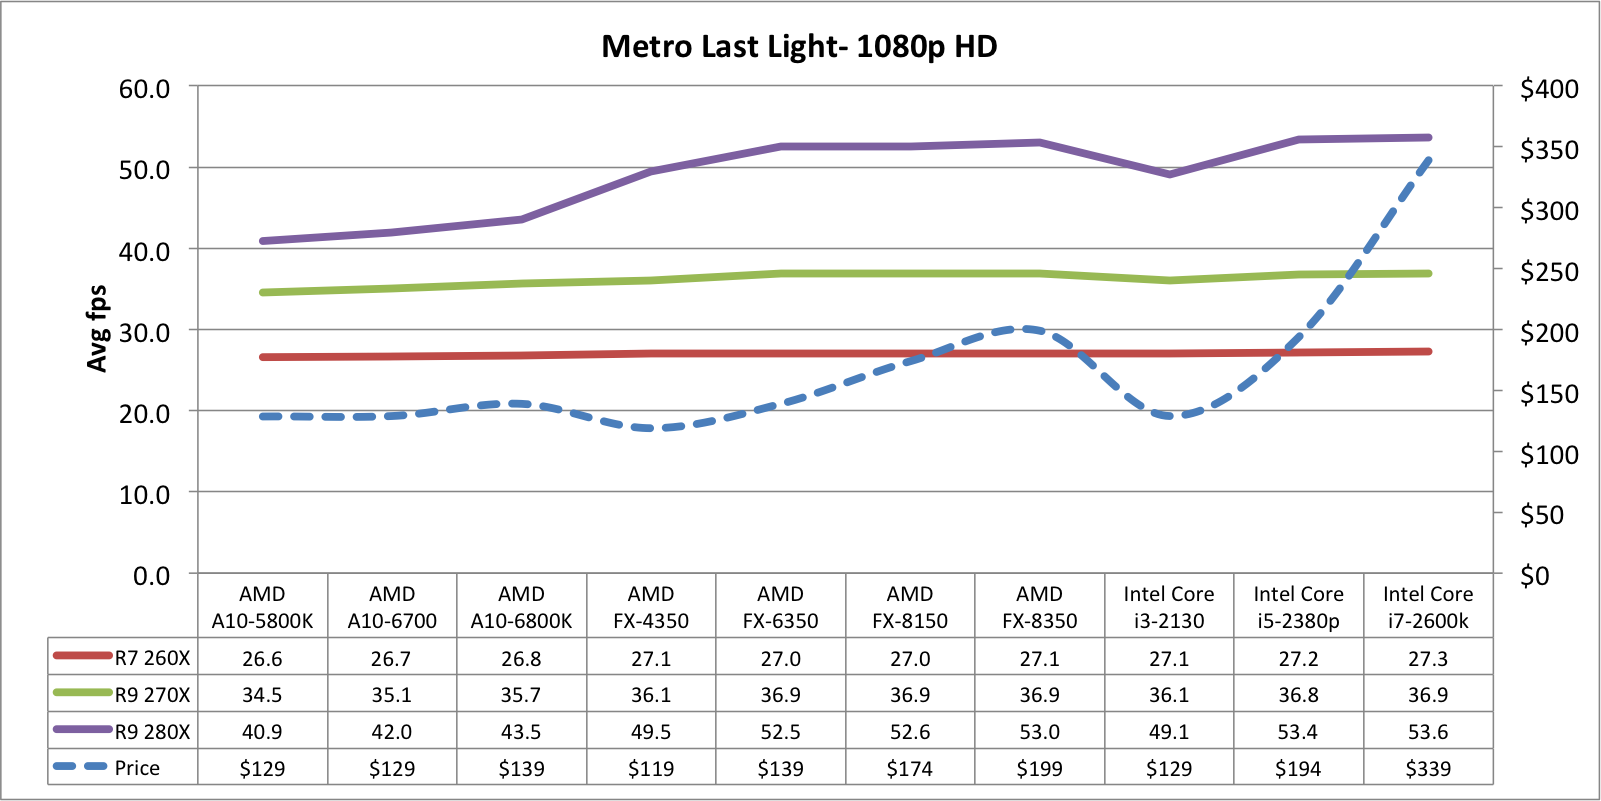
Looking at 1080p HD widescreen performance, the different CPUs provide absolutely no performance improvement for the R7 260X. There is less than 1fps difference between the lowest and highest processors. This is well within the margin of error.
For the R9 270X, the AMD FX processors provide a frame or two improvement over the AMD APUs, but performance levels off there through the Core processors.
There is marked improvement through the performance of the R9 280X. The AMD FX processors provide ~10fps improvement over the AMD APUs, which is a roundly 25% performance increase. For the FX-4350 and FX-6350, there is no price increase required. The FX-8350 gives an extra frame or two, but comes at a 50% higher price tag.
The Core i5-2380p performs similar to the FX-8350, at a similar price point. However, the Core i7-2600k offers no performance in crease, but costs significantly more than the other chips.
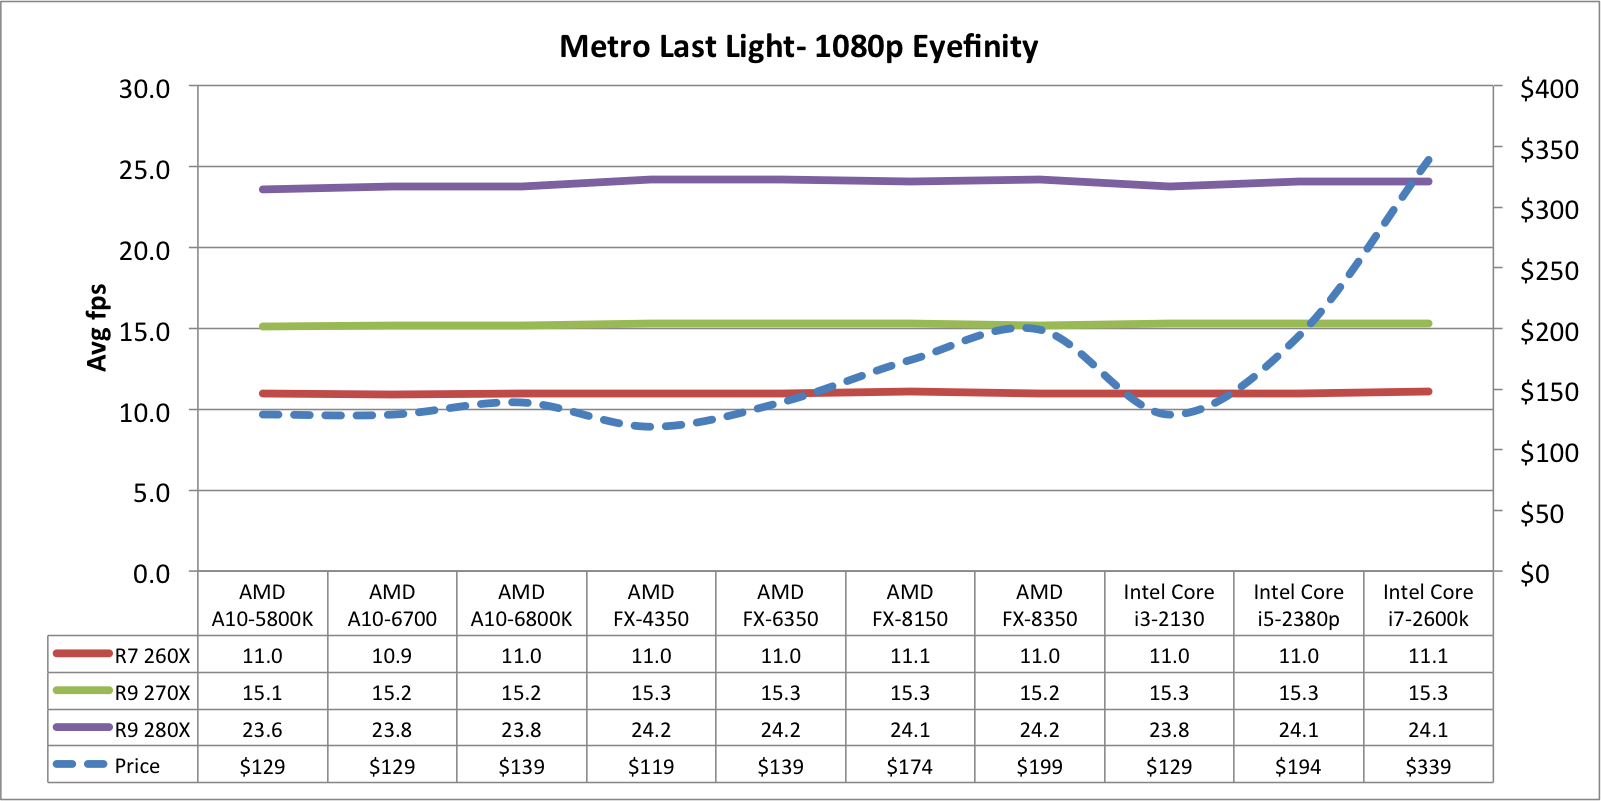
For Eyefinity, all chips perform within 1fps of each other, for each respective GPU. There is no value provided in purchasing significantly higher priced chips.