Unigine Valley
I have previously used the Unigine Heaven demo in GPU benchmarking. For this test I have upgraded to the Unigine Valley demo. The test was run at "High" quality, with 2X AA.
I let the benchmark load and run through a full cycle, and manually triggered the benchmark mode and then FRAPS when the images first appear on screen. I stopped FRAPS as the demo faded out.
1080p Widescreen
| Unigine Valley - 1080p HD | Unigine Valley - 1080p HD CrossFire | |||||||||||||||||||||||||||
| R7 260X | R9 270X | R9 280X | R9 290 | R7 260X CFX | R9 270X CFX | R9 280X CFX | ||||||||||||||||||||||
| Min | Avg | Max | Min | Avg | Max | Min | Avg | Max | Min | Avg | Max | Min | Avg | Max | Min | Avg | Max | Min | Avg | Max | ||||||||
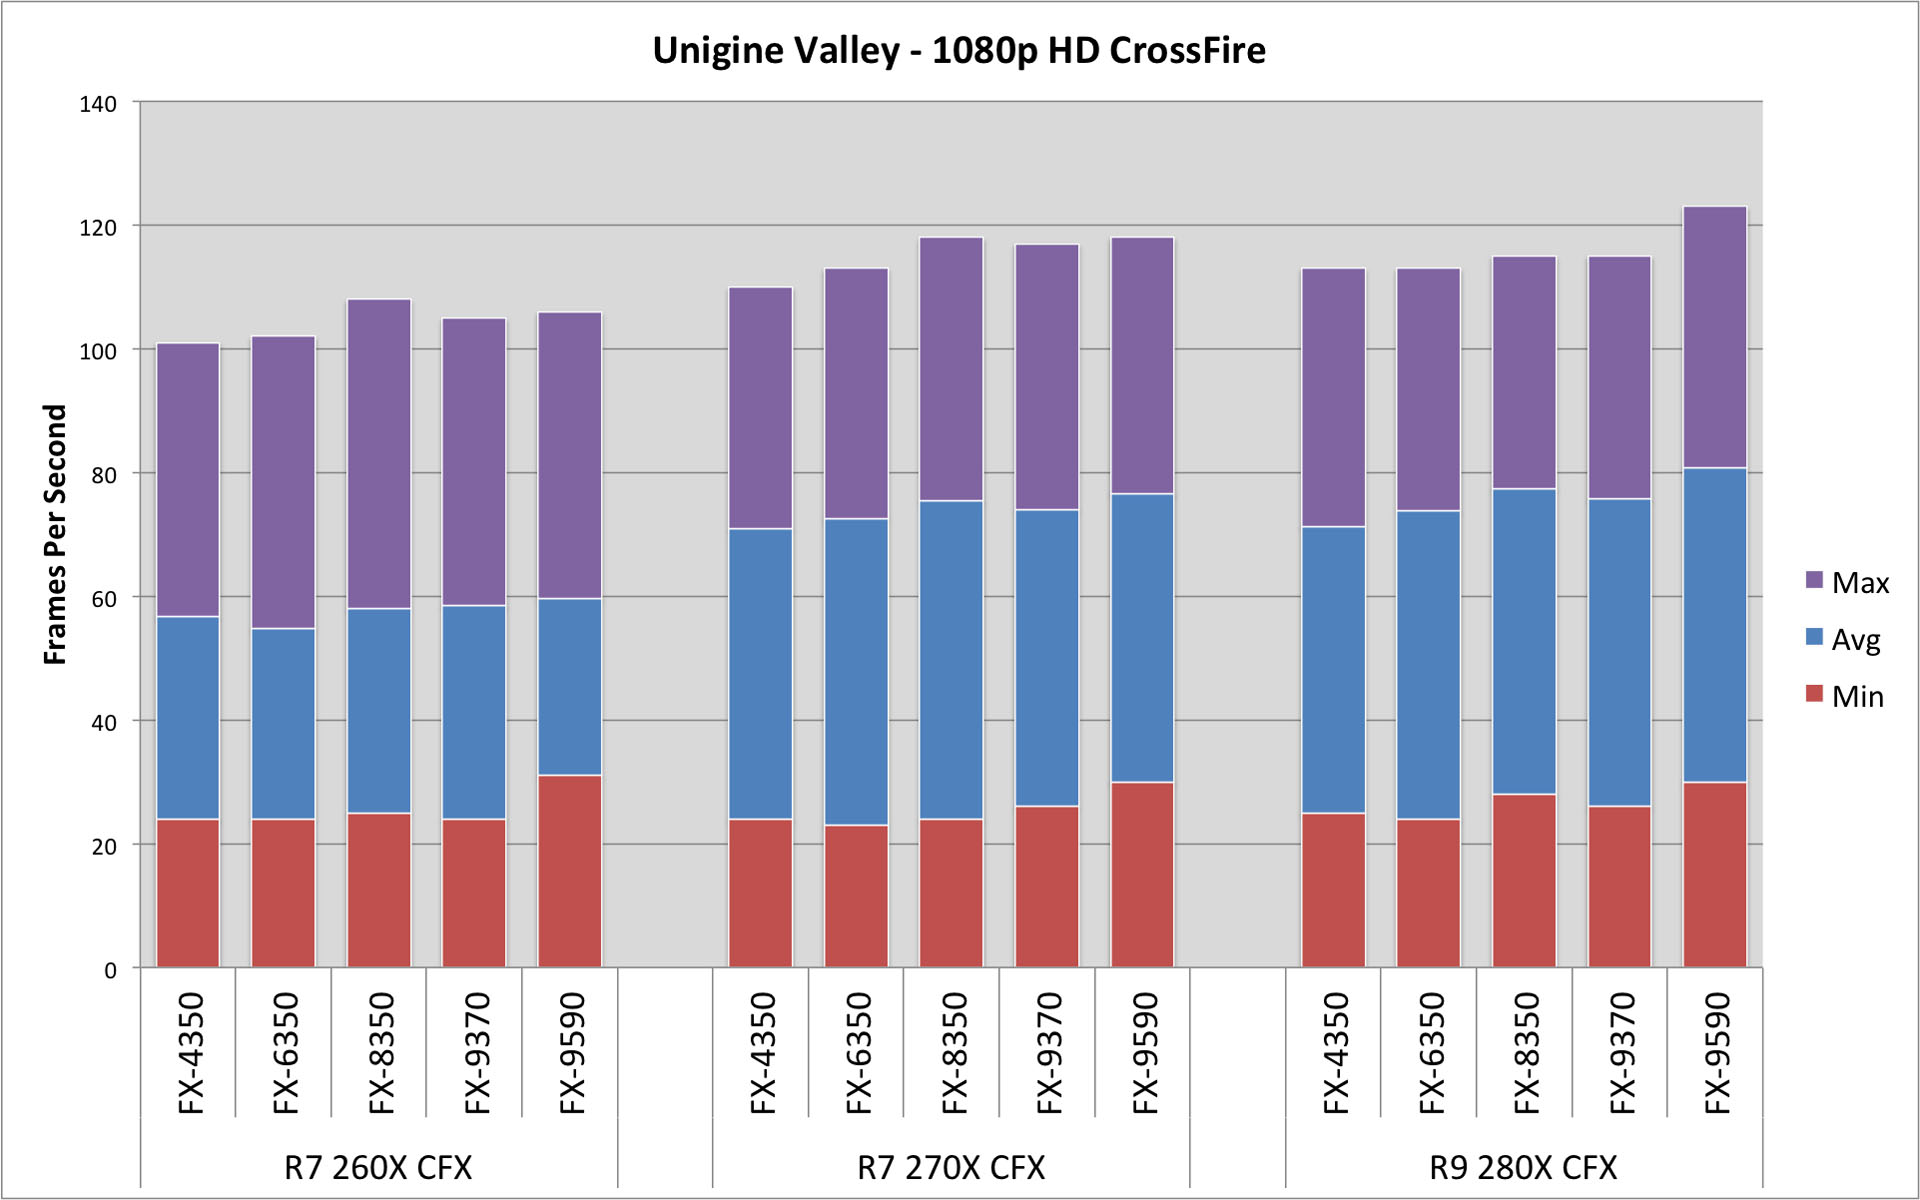
| AMD FX-9590 | 20 | 32.5 | 58 | 38 | 48.8 | 87 | 37 | 64.1 | 114 | 36 | 76.0 | 121 | 31 | 59.6 | 106 | 30 | 76.6 | 118 | 30 | 80.7 | 123 | |||||||
| AMD FX-9370 | 18 | 32.5 | 59 | 29 | 48.8 | 88 | 30 | 63.2 | 113 | 29 | 74.0 | 112 | 24 | 58.5 | 105 | 26 | 74.0 | 117 | 26 | 75.7 | 115 | |||||||
| AMD FX-8350 | 16 | 31.7 | 58 | 22 | 45.8 | 83 | 23 | 62.5 | 108 | 28 | 73.0 | 111 | 25 | 58.0 | 108 | 24 | 75.4 | 118 | 28 | 77.4 | 115 | |||||||
| AMD FX-6350 | 15 | 31.6 | 58 | 18 | 45.6 | 83 | 19 | 64.5 | 101 | 29 | 71.0 | 110 | 24 | 54.8 | 102 | 23 | 72.5 | 113 | 24 | 73.6 | 113 | |||||||
| AMD FX-4350 | 14 | 31.7 | 58 | 18 | 45.9 | 84 | 19 | 63.3 | 100 | 28 | 70.0 | 107 | 24 | 56.7 | 101 | 24 | 71.0 | 110 | 25 | 71.3 | 113 | |||||||
We do see som improvement across the CPU line, when paired with a single R9 280X or an R9 290. There are some clear instances (the R9 280X in particular) where minimum fps showed a major improvement with a better CPU. Max fps improved as well, but the averages held constantly.
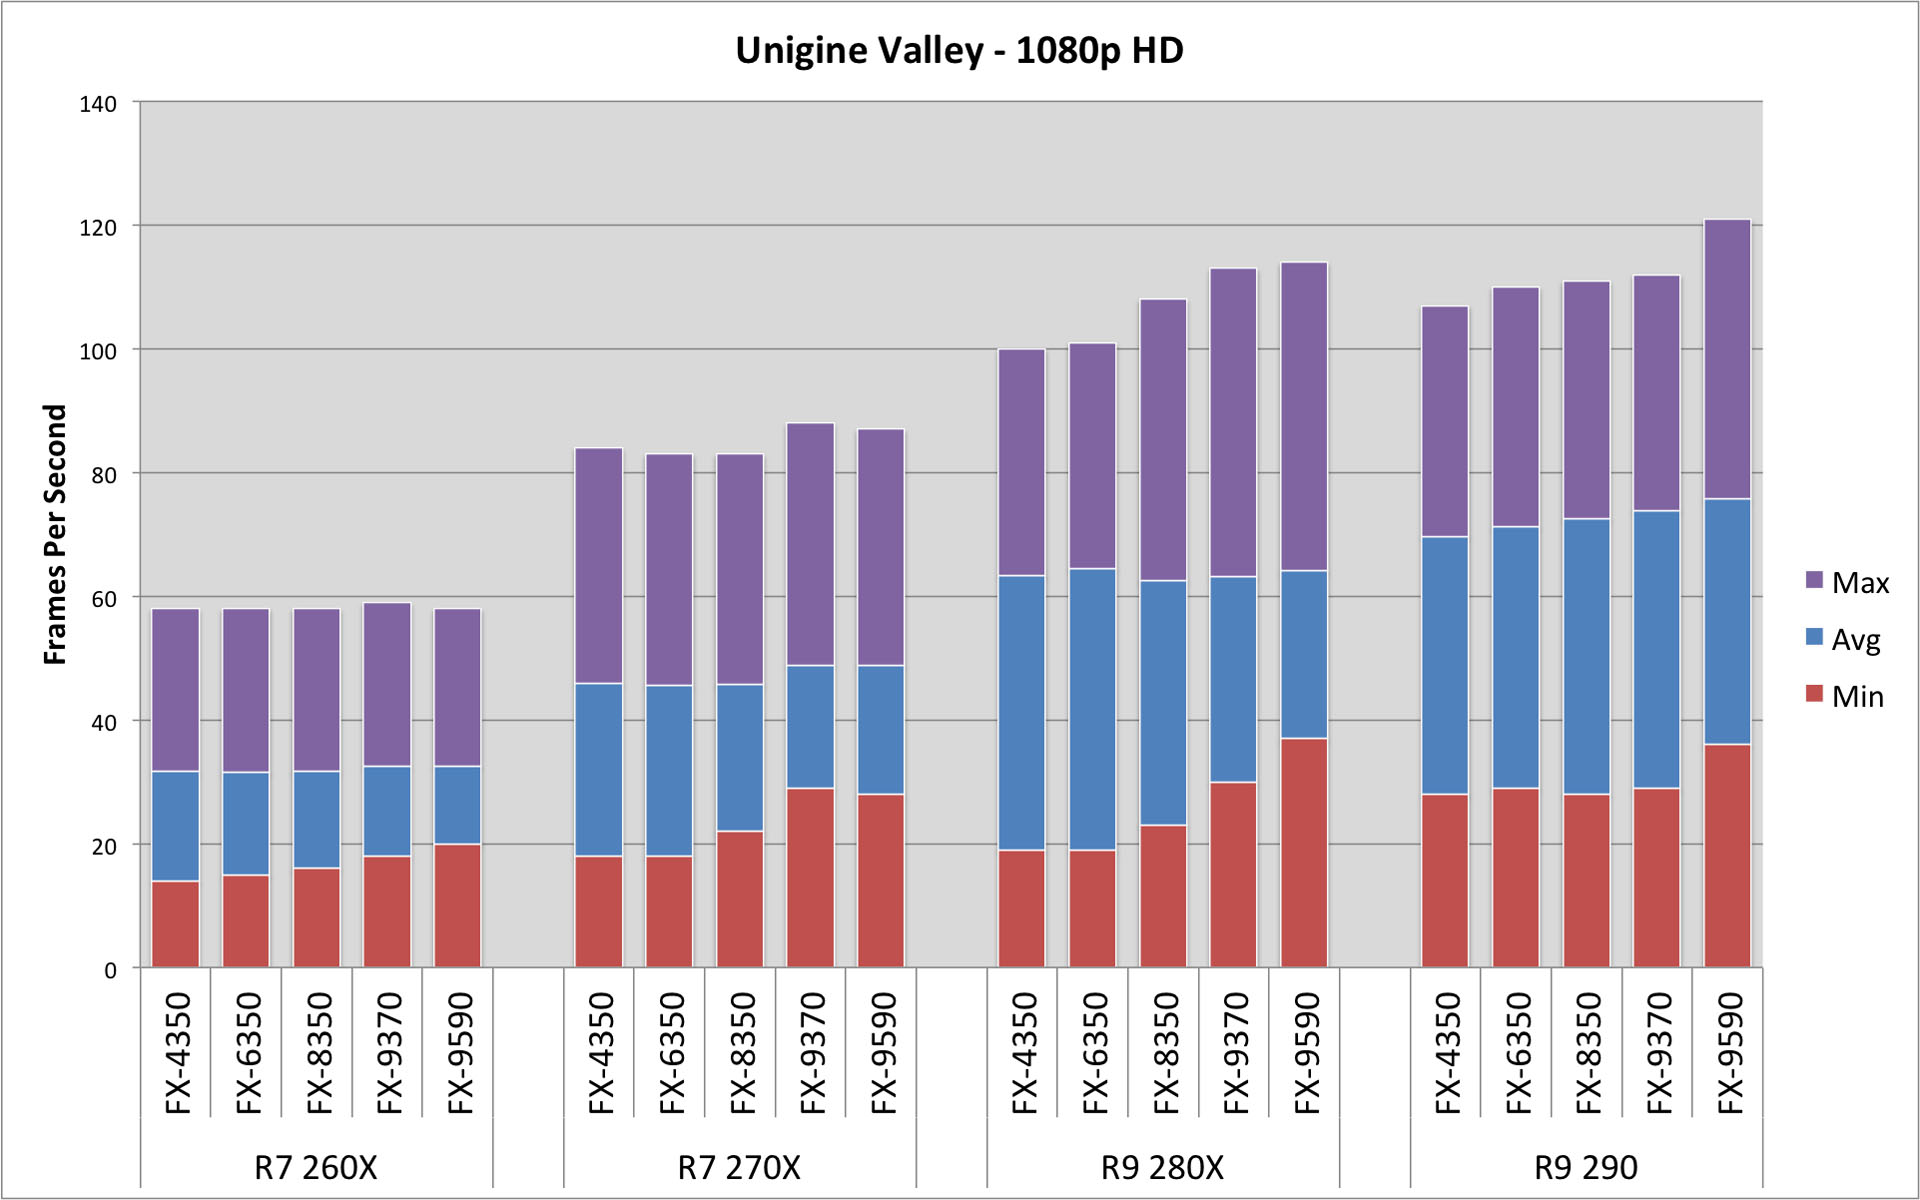
Using a pair of video cards, we see comparable performance across the board. In each bank we don't see a CPU that can unlock any untapped power of the GPU.
1080p Eyefinity
| Unigine Valley - Eyefinity | Unigine Valley - Eyefinity CrossFire | |||||||||||||||||||||||||||
| R7 260X | R9 270X | R9 280X | R9 290 | R7 260X CFX | R9 270X CFX | R9 280X CFX | ||||||||||||||||||||||
| Min | Avg | Max | Min | Avg | Max | Min | Avg | Max | Min | Avg | Max | Min | Avg | Max | Min | Avg | Max | Min | Avg | Max | ||||||||
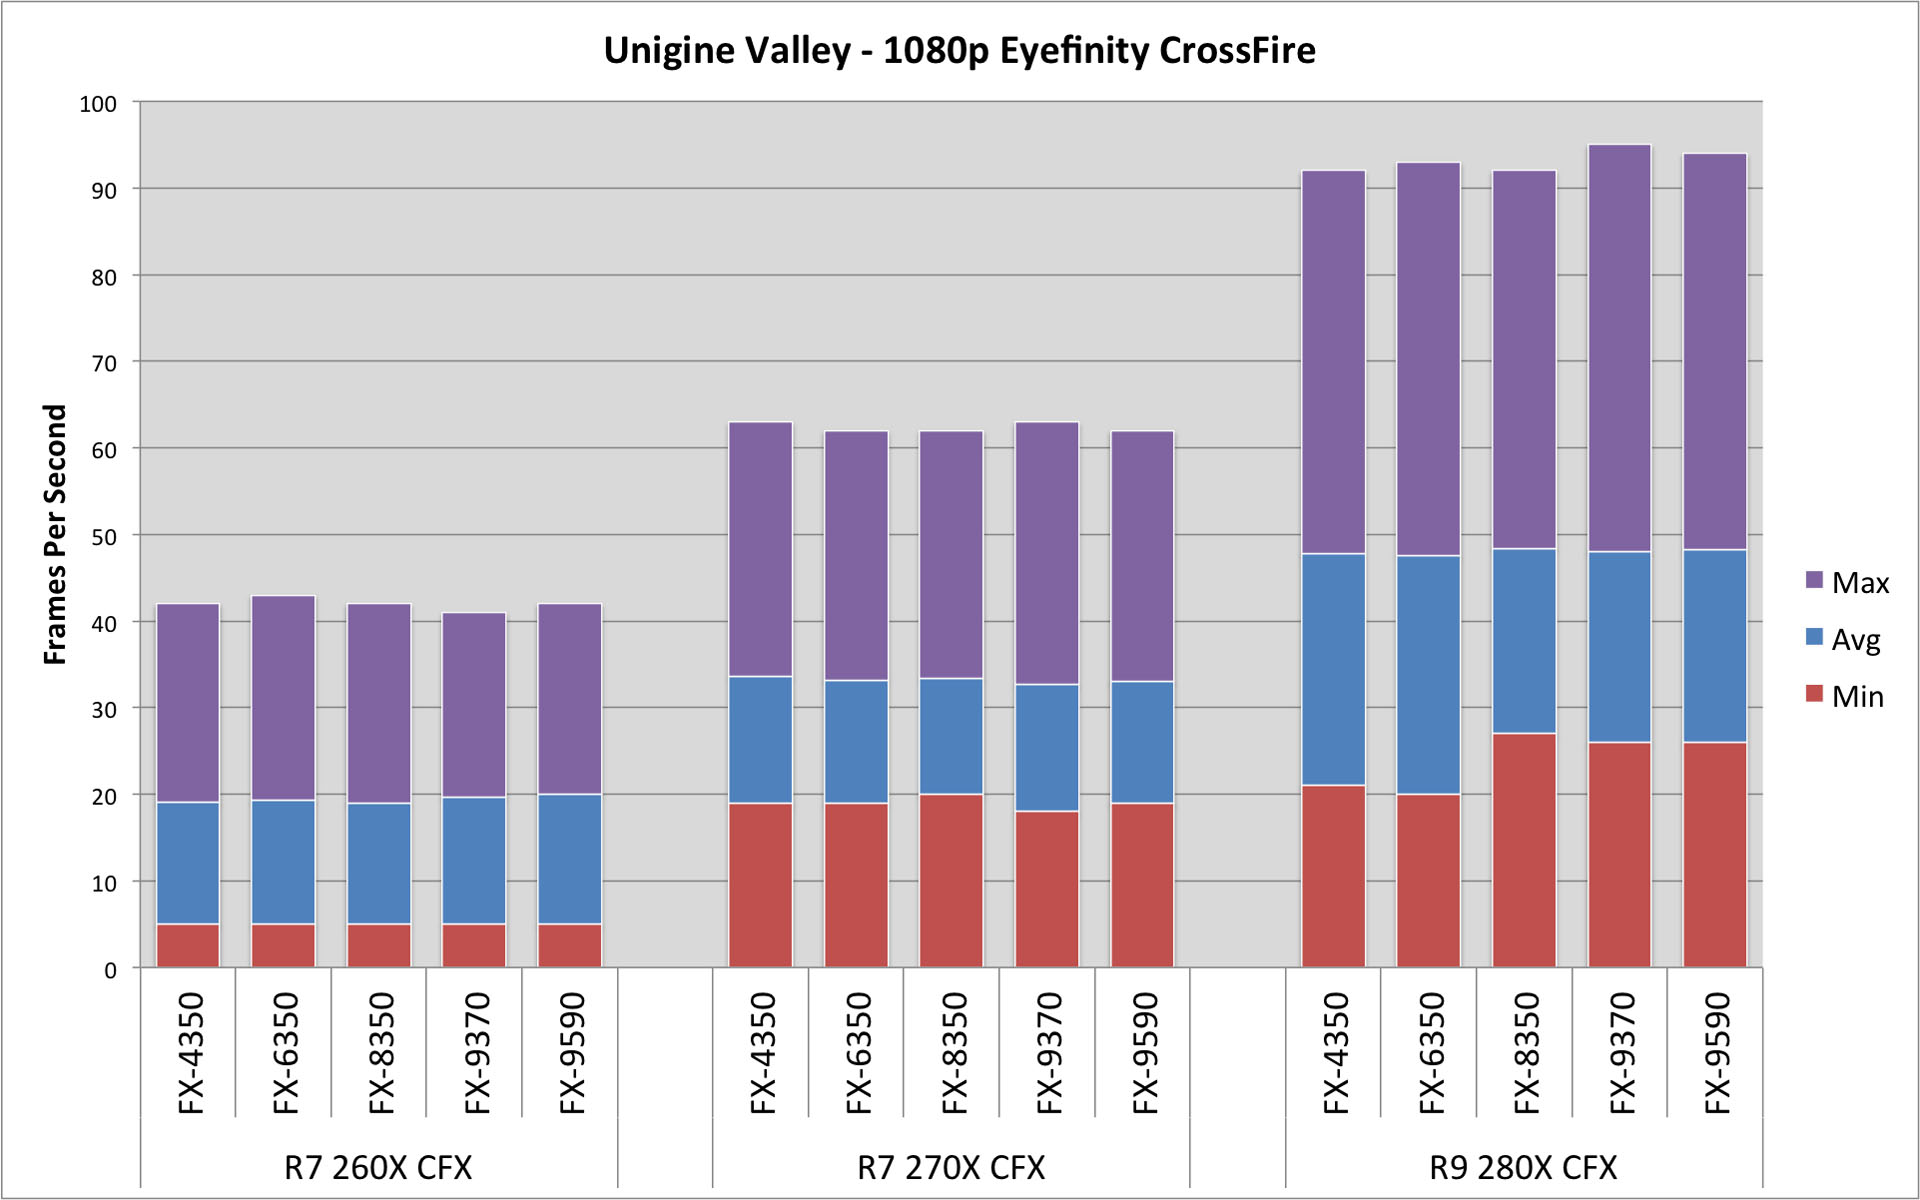
| AMD FX-9590 | 5 | 11.5 | 22 | 11 | 18.1 | 35 | 14 | 25.5 | 50 | 18 | 31.5 | 58 | 5 | 20.0 | 42 | 19 | 33.0 | 62 | 26 | 48.2 | 94 | |||||||
| AMD FX-9370 | 4 | 11.5 | 22 | 11 | 18.1 | 33 | 15 | 25.5 | 49 | 19 | 31.4 | 58 | 5 | 19.7 | 41 | 18 | 32.7 | 63 | 26 | 48.0 | 95 | |||||||
| AMD FX-8350 | 1 | 10.2 | 24 | 7 | 16.9 | 35 | 11 | 25.3 | 52 | 16 | 31.2 | 59 | 5 | 19.0 | 42 | 20 | 33.4 | 62 | 27 | 48.4 | 92 | |||||||
| AMD FX-6350 | 2 | 10.6 | 24 | 7 | 16.9 | 35 | 11 | 25.3 | 52 | 18 | 29.6 | 55 | 5 | 19.3 | 43 | 19 | 33.2 | 62 | 20 | 47.6 | 93 | |||||||
| AMD FX-4350 | 2 | 10.7 | 24 | 7 | 16.9 | 35 | 11 | 25.3 | 152 | 18 | 31.1 | 59 | 5 | 19.1 | 42 | 19 | 33.6 | 63 | 21 | 47.8 | 92 | |||||||
With the Eyefinity trials, we actually see an instance where the top two CPUs perform slightly worse at max fps. Granted it is just 1-2 fps, but it is consistent. We do see that the higher end CPUs provide improvement for minimum fps.
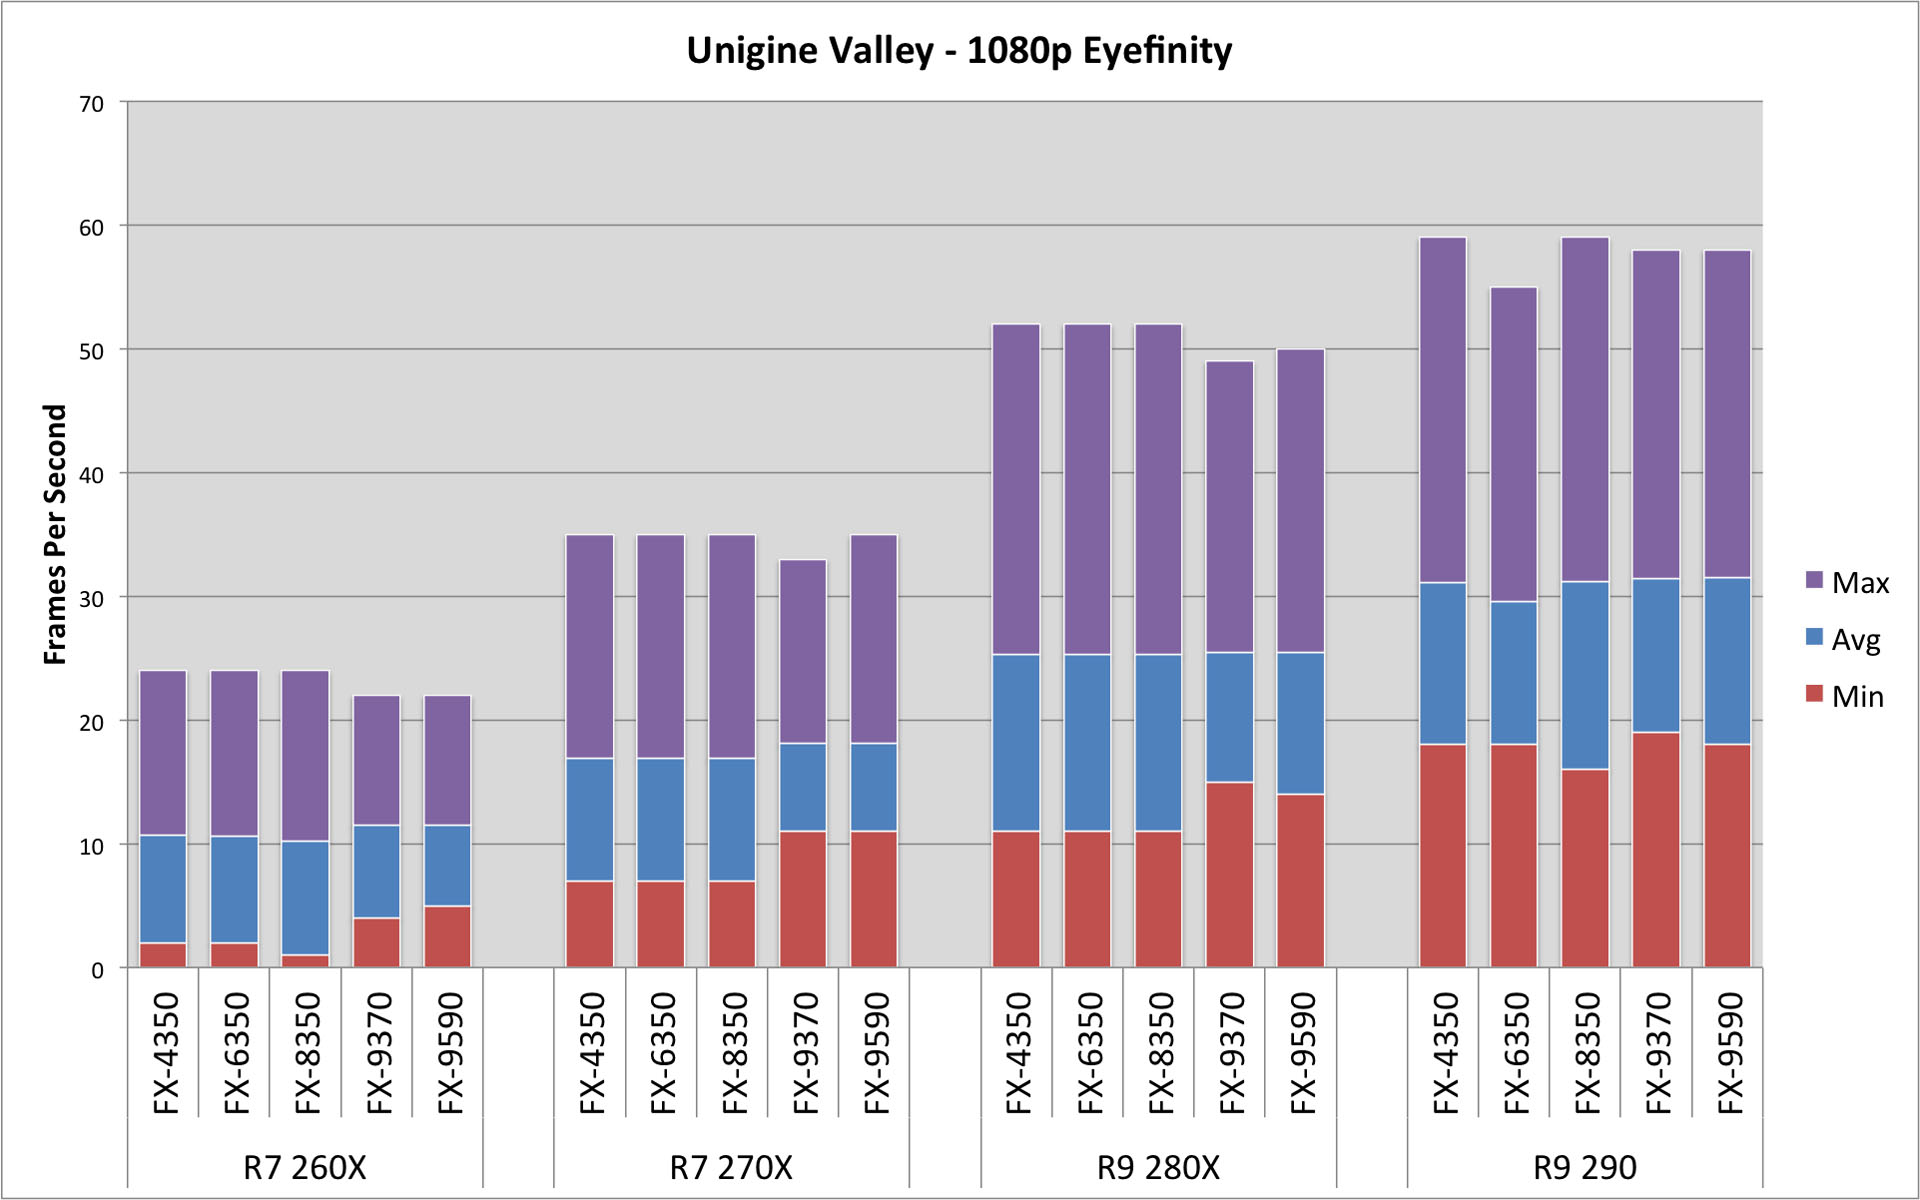
As with the single 1080p test, we see comparable performance across the board. Again, we're left with blocked groupings.