Benchmarking (cont.)
DiRT Showdown
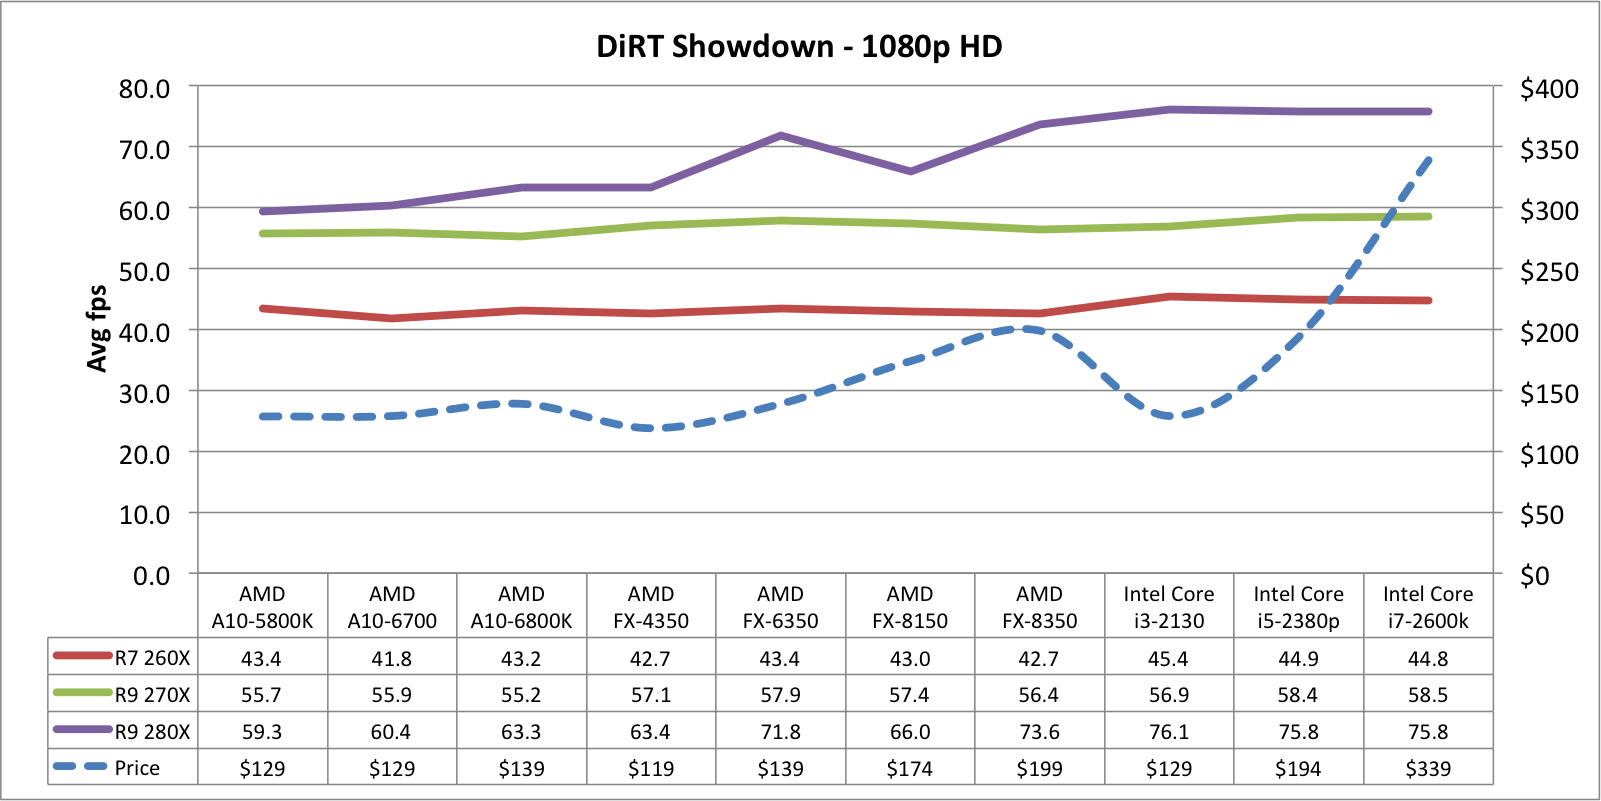
DiRT Showdown was tested at the Ultra setting pre-set, with 4X MSAA enabled. The test was run three separate times, with the testing done on the third pass. FRAPS was manually started with the benchmark fly-by of the track. It was subsequently stopped right before the car crossed the finish line, prior to the slow motion scene of the finish.
Please note that the DiRT Showdown test is not a canned demo like Metro Last Light or Unigine Valley. It is a sample race in a figure-eight style track. The cars jockey for position with the driver AI, and each run is inherently different.
Small variances between runs should be discounted, due to this variation between the actual tests. I did toss out any test run that had any crashes or a stuck car.
| DiRT Showdown - 1080p HD | DiRT Showdown - 1080p Eyefinity | |||||||||||||||||||||||
| R7 260X | R9 270X | R9 280X | R7 260X | R9 270X | R9 280X | |||||||||||||||||||
| Min | Avg | Max | Min | Avg | Max | Min | Avg | Max | Min | Avg | Max | Min | Avg | Max | Min | Avg | Max | |||||||
| Intel Core i7-2600k | 37 | 44.8 | 62 | 47 | 58.5 | 79 | 61 | 75.8 | 102 | 17 | 20.6 | 29 | 22 | 27.5 | 40 | 32 | 39.2 | 55 | ||||||
| Intel Core i5-2380p | 37 | 44.9 | 62 | 46 | 58.4 | 79 | 61 | 75.8 | 101 | 16 | 20.4 | 29 | 22 | 27.5 | 39 | 32 | 39.4 | 54 | ||||||
| Intel Core i3-2130 | 36 | 45.4 | 62 | 47 | 56.9 | 79 | 58 | 76.1 | 103 | 16 | 20.5 | 29 | 22 | 27.3 | 39 | 32 | 39.3 | 55 | ||||||
| AMD FX-8350 | 35 | 42.7 | 59 | 47 | 56.4 | 79 | 61 | 73.6 | 99 | 16 | 20.0 | 28 | 22 | 27.4 | 39 | 32 | 39.3 | 54 | ||||||
| AMD FX-8150 | 36 | 43.0 | 43 | 46 | 57.4 | 79 | 53 | 66.0 | 97 | 16 | 20.0 | 28 | 22 | 27.3 | 39 | 28 | 39.1 | 54 | ||||||
| AMD FX-6350 | 36 | 43.4 | 59 | 48 | 57.9 | 78 | 60 | 71.8 | 100 | 15 | 19.9 | 28 | 23 | 27.2 | 39 | 30 | 39.0 | 54 | ||||||
| AMD FX-4350 | 34 | 42.7 | 59 | 44 | 57.1 | 77 | 55 | 63.4 | 96 | 16 | 19.9 | 29 | 22 | 27.5 | 39 | 31 | 38.7 | 54 | ||||||
| AMD A10-6800K | 35 | 43.2 | 58 | 46 | 55.2 | 76 | 51 | 63.3 | 88 | 16 | 19.8 | 28 | 22 | 27.2 | 38 | 32 | 38.5 | 53 | ||||||
| AMD A10-6700 | 34 | 41.8 | 58 | 47 | 55.9 | 76 | 48 | 60.4 | 89 | 16 | 20.0 | 28 | 22 | 27.4 | 38 | 32 | 38.9 | 53 | ||||||
| AMD A10-5800K | 35 | 43.4 | 58 | 44 | 55.7 | 76 | 44 | 59.3 | 89 | 16 | 19.8 | 28 | 22 | 27.0 | 38 | 30 | 38.3 | 53 | ||||||
Widescreen performance here mirrors that of Metro Last Light. There is at most a frame or two difference across the processors for both the R7 260X and the R9 270X.
With the R9 280X, performance starts out similar to the R7 260X, with the AMD APU processors. The AMD APUs are effectively throttling the R& 260X.
We start to see the impacts of the additional processing power at the FX-6350 and FX-8350. We see an increase of 8-10fps with these chips, over the AMD APUs.
The Core i3 performs quite well here, especially considering the lower price. The Core i5 performs in line with the FX-8350, again for a comparable price. There is no improvement to be found with the significantly more expensive Core i7 offering.
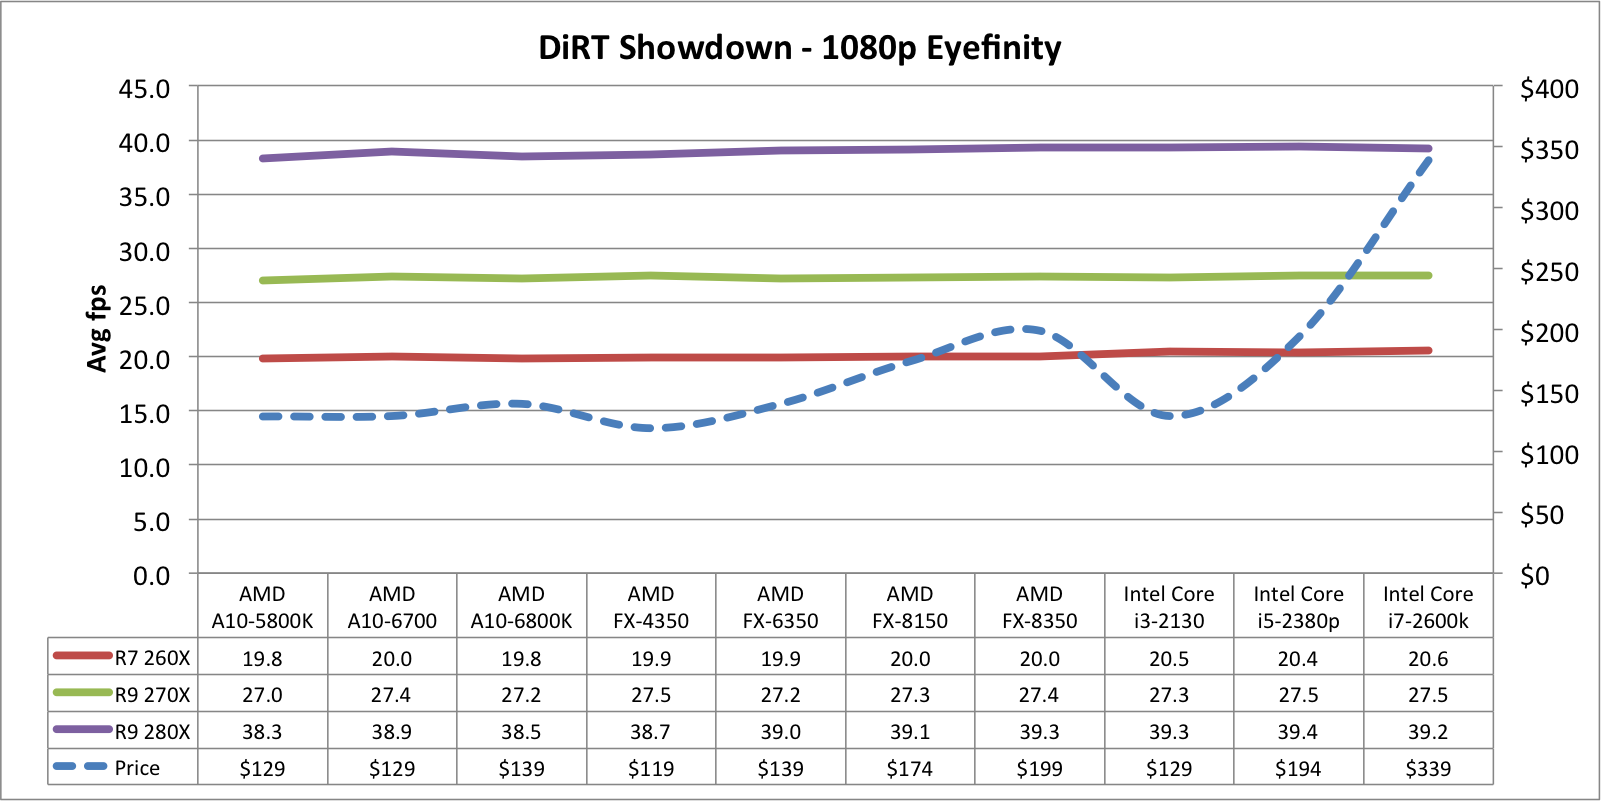
As we saw before with Metro Last Light, here is no performance increase from a larger processor, for Eyefinity or Surround users running a single GPU.
Unigine Valley
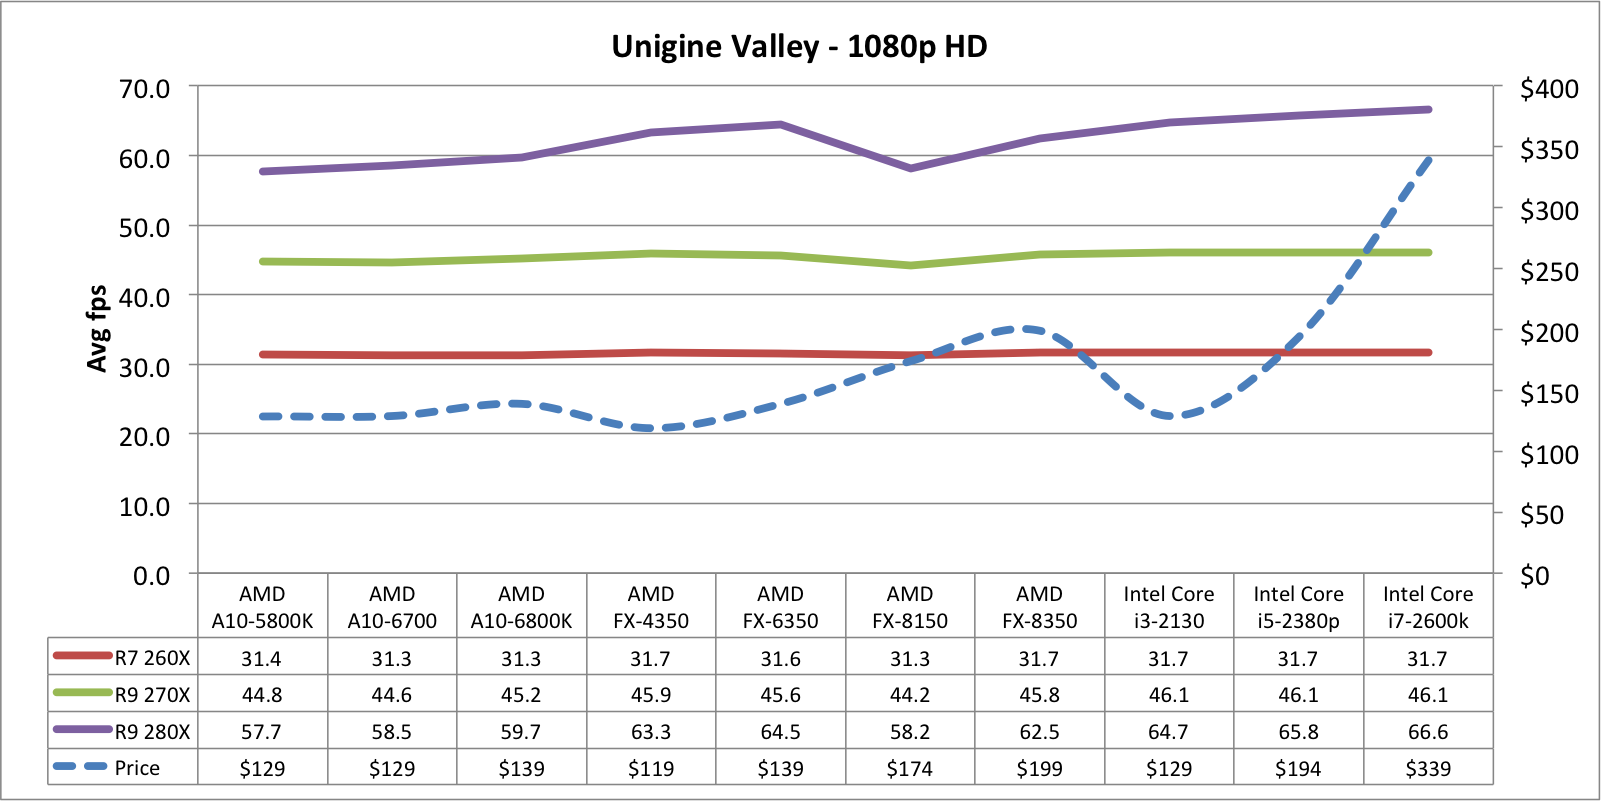
I have previously used the Unigine Heaven demo in GPU benchmarking. For this test I have upgraded to the Unigine Valley demo. The test was run at "High" quality, with 2X AA.
I let the benchmark load and run through a full cycle, and manually triggered the benchmark mode and then FRAPS when the images first appear on screen. I stopped FRAPS as the demo faded out.
| Unigine Valley - 1080p HD | Unigine Valley - 1080p Eyefinity | |||||||||||||||||||||||
| R7 260X | R9 270X | R9 280X | R7 260X | R9 270X | R9 280X | |||||||||||||||||||
| Min | Avg | Max | Min | Avg | Max | Min | Avg | Max | Min | Avg | Max | Min | Avg | Max | Min | Avg | Max | |||||||
| Intel Core i7-2600k | 15 | 31.7 | 58 | 26 | 46.1 | 83 | 35 | 66.6 | 124 | 2 | 10.5 | 25 | 6 | 16.9 | 35 | 12 | 25.3 | 53 | ||||||
| Intel Core i5-2380p | 16 | 31.7 | 59 | 25 | 46.1 | 84 | 33 | 65.8 | 123 | 2 | 10.7 | 25 | 7 | 16.9 | 35 | 11 | 25.4 | 53 | ||||||
| Intel Core i3-2130 | 15 | 31.7 | 59 | 25 | 46.1 | 84 | 33 | 64.7 | 114 | 2 | 10.7 | 25 | 7 | 16.9 | 35 | 11 | 25.4 | 53 | ||||||
| AMD FX-8350 | 16 | 31.7 | 58 | 22 | 45.8 | 83 | 23 | 62.5 | 108 | 1 | 10.2 | 24 | 7 | 16.9 | 35 | 11 | 25.3 | 52 | ||||||
| AMD FX-8150 | 13 | 31.3 | 60 | 15 | 44.2 | 83 | 16 | 58.2 | 92 | 1 | 10.6 | 24 | 6 | 16.6 | 35 | 10 | 25.3 | 53 | ||||||
| AMD FX-6350 | 15 | 31.6 | 58 | 24 | 45.6 | 83 | 24 | 64.5 | 101 | 2 | 10.6 | 24 | 7 | 16.9 | 35 | 11 | 25.3 | 52 | ||||||
| AMD FX-4350 | 14 | 31.7 | 58 | 25 | 45.9 | 84 | 24 | 63.3 | 99 | 2 | 10.7 | 24 | 7 | 16.9 | 35 | 11 | 25.3 | 53 | ||||||
| AMD A10-6800K | 14 | 31.3 | 58 | 23 | 45.2 | 83 | 24 | 59.7 | 91 | 2 | 10.5 | 24 | 6 | 16.8 | 35 | 11 | 25.2 | 52 | ||||||
| AMD A10-6700 | 16 | 31.3 | 58 | 22 | 44.6 | 82 | 22 | 58.5 | 92 | 2 | 10.0 | 23 | 6 | 16.9 | 36 | 11 | 25.2 | 52 | ||||||
| AMD A10-5800K | 15 | 31.4 | 58 | 22 | 44.8 | 82 | 21 | 57.7 | 91 | 2 | 10.3 | 25 | 7 | 16.8 | 35 | 11 | 25.1 | 52 | ||||||
With our third test, we are seeing a consistent pattern. There is little to no benefit of any higher powered processing unit, when paired with the R9 270X or the R9 280X.
With the R9 280X, we see an uptick in performance with the FX-4350. However, the performance across the FX series is fairly consistent. As we saw previously, there is an additional frame or two to be gained with the Core CPUs.
As before, the Core i5 and the FX-8350 offer similar price and performance. And, the price/performance ratio of the Core i7 is lacking compared to other chips.
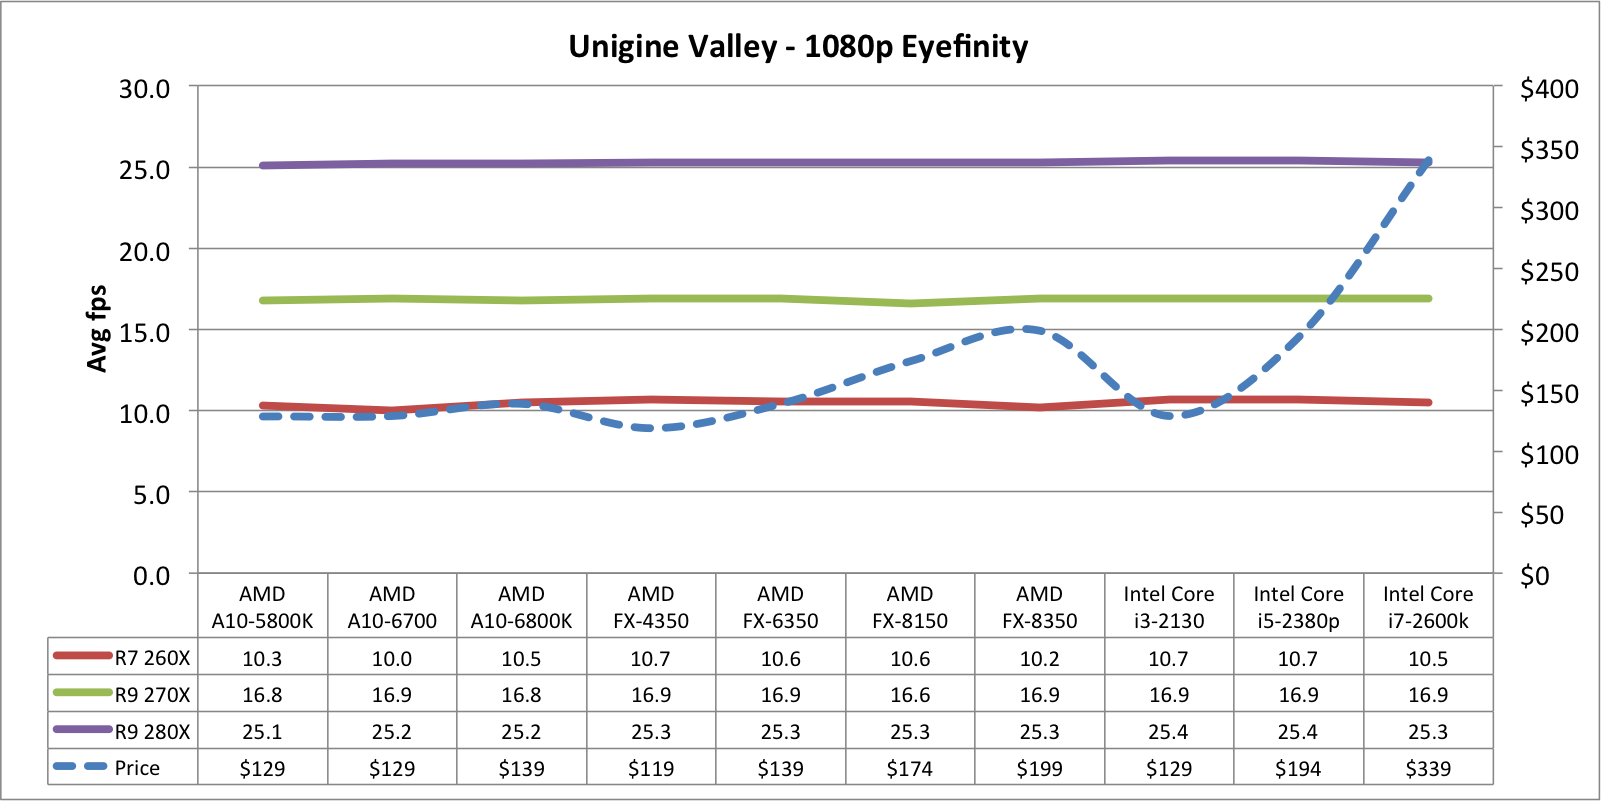
And again we see a third data set in a similar trend. There is no performance increase to be had with a more powerful processor when running Eyefinity or Surround.
Conclusions
| Component Prices | R7 260X | R9 270X | R9 280X | |
| $139 | $199 | $299 | ||
| Intel Core i7-2600k | $339 | $478 | $538 | $638 |
| Intel Core i5-2380p | $194 | $333 | $393 | $493 |
| Intel Core i3-2130 | $129 | $268 | $328 | $428 |
| AMD FX-8350 | $199 | $338 | $398 | $498 |
| AMD FX-8150 | $174 | $313 | $373 | $473 |
| AMD FX-6350 | $139 | $278 | $338 | $438 |
| AMD FX-4350 | $119 | $258 | $318 | $418 |
| AMD A10-6800K | $139 | $278 | $338 | $438 |
| AMD A10-6700 | $129 | $268 | $328 | $428 |
| AMD A10-5800K | $129 | $268 | $328 | $428 |
The results here honestly surprised me. I had expected increasingly powerful processors to provide at least some performance increase at each step of the way. And the results show that this simply isn't the case.
The findings are as such...
Widescreen - 1080p HD
- There is absolutely no performance improvement to be had on a single HD screen, when paired with a Radeon R7 260X.
- There are minor performance improvements in 1080p HD, when paired with a Radeon HD R9 270X. These improvements peak at the R9 270X, with no improvements beyond that.
- There are noticeable improvements in performance with CPUs, when paired with the R9 280X. These hit a plateau around the FX-6350 or the FX-8350, with some small performance improvements in the Intel Core processors.
Eyefinity - 3x 1080p HD
- There is absolutely no performance improvement to be had in an Eyefinity or Surround configuration, when paired with any single GPU
General Observations
- There is no need for a Core i7-2600k, for gaming. This processor offers no realistic performance improvements in games, and cost significantly more than other chips.
- The "sweet spot" for CPUs seems to be at the AMD FX-6350 or Intel i3-2130
- There is good money to be saved in CPU purchase that can go into a better or 2nd GPU, or an SSD, etc.
We are really at a time of processor power where gamers need to rethink their old paradigms. We've always looked to the "biggest and best", or at least as close to that as we can get. These processor findings challenge that thinking.
Many gamers would turn their nose up at the idea of using an APU for their central processing. And many have similar reactions to lower end AMD FX processors, and especially the Intel Core i3. However, the data tells us they should give these options consideration.
For example... A Core i3-3120 paired with a Radeon R9 270X costs a similar amount of money as a Core i5-2380p paired with a Radeon R7 260X. However, the first pair offer significantly better performance.
Additionally... an AMD FX-6350 saves you $60 over the cost of the Core i5-2380p. This $60 pays for an upgrade from the R7 260X to the R9 270X. And it would pay for the majority of an upgrade from an R9 270X, to an R9 280X. It also pays for a 64GB SSD boot drive.
Only when paired with a high end GPU like the Radeon R9 280X do bigger more expensive CPUs make a difference. An even then the value tops out with the FX-8350 and the Core i7-2380p.
Unless you're creating games, rendering video, compiling large amounts of code, or some other processor intensive task - you're wasting your money on a processor over $200. It comes down to whether you are consuming media, or creating it. You need the horsepower for creation - not consumption.
Even with the data, I keep finding myself wanting to type something like, "The FX-6350 is a great performer, but you may want to go ahead and spend the little extra for the faster FX-8350". The hardware paradigm shift even needs to take place with me. Given the current economic times, we all need to ensure we getting the best value for our money and not spending needlessly. And I'm hoping this article helps you do that.
Next Steps
I need to test with a multi-GPU setup. This additional processing power may open up CPU performance in Eyefinity, and/or offer a more traditional scaling in HD widescreen.
The testing in this article was intensive, and took weeks to complete. At this time, I simply don't have the time to go through another 180 testing routines. I used the same components to test the AMD APU and FX chips. At this point I don't have the time to go through all of those hardware swaps and rebuilds. Additionally I sold my Intel Core i7 rig, and no longer have access to that hardware.
Given their general improvement over the AMD APUs, and their similar performance to the Intel Core chips, I think they will be a good indicator of performance.