I don't know exactly how other sites and magazines test hardware. But, I do know that they do it as a full-time job, and have a lot more equipment and time at their disposal. They are also "on the hook" to provide a consistent testbed for products from different companies, and to provide a consistent testbed across weeks and months. I can assure you that my testing methods weren't as stringent as those reviewers, but I do believe they reflect a real-world look at the hardware.
As mentioned earlier, I ghosted a drive with a clean install of WinXP SP2. I then updated that install with the latest Windows patches (just prior to SP3), and the latest drivers and BIOS from ASUS (mobo), NVIDIA and Creative Labs. I then installed every game that I was considering for this benchmarking exercise. Then, I began the benchmarking.
I didn't go through and strip Windows down to a limited set of drivers and services. On the contrary, I had a "normal" (but clean) install of Windows running, along with my "normal" run-down of programs such as Steam, AVG Anti-Virus, X-Fire and FRAPS.
Also, unless I needed to, I didn't restart the game and/or the machine during each test. Some games, like Oblivion, require a restart to change the resolution; and some games like World in Conflict showed diminishing numbers between runs, if the machine wasn't rebooted. But, for games like LOTRO and Bioshock, I simply ran one test after the other. Details on each benchmark process is outlined for each game.
Also, everything was run at stock clocks and speeds. Nothing is overclocked.
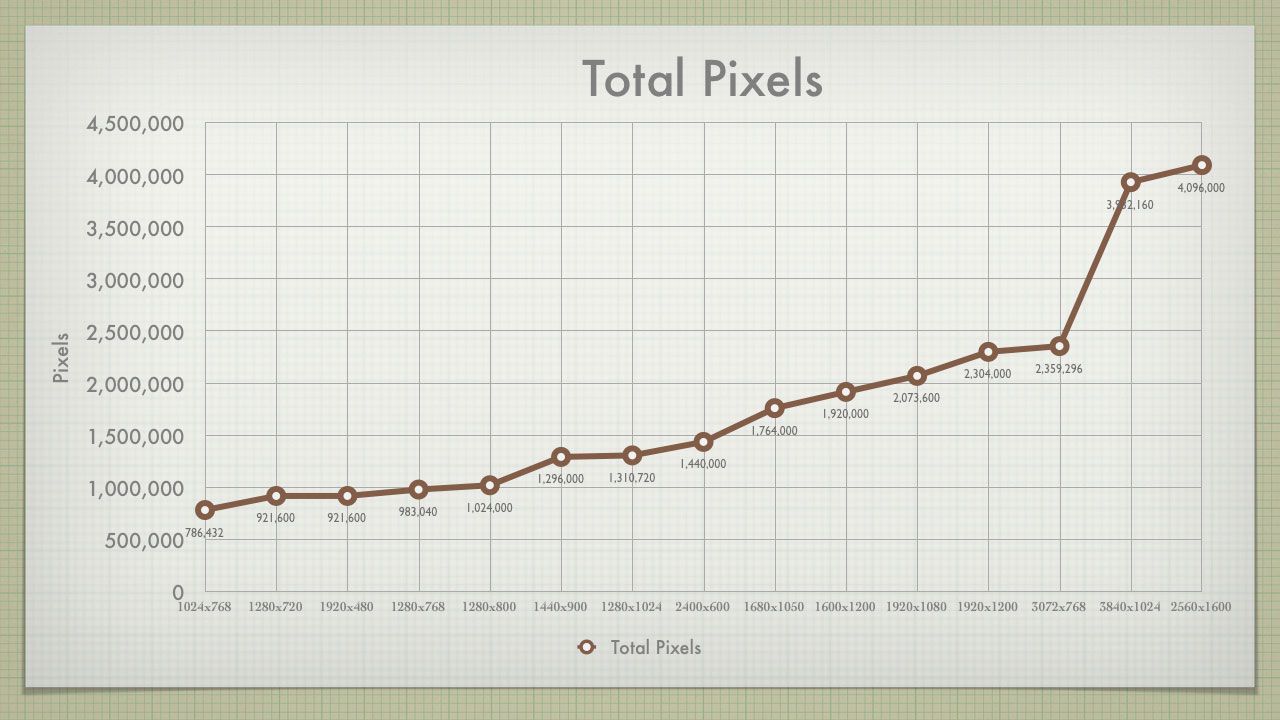
Total Pixel Counts
This graph shows the total pixels at each resolution. The resolutions are listed by the total pixel count. I have included all the common 4:3, Widescreen and Surround Gaming resolutions. The resolutions covered are:
- 5:4 - 1280x1024
- 4:3 - 1024x768, 1600x1200
- 16:10 - 1280x800, 1680x1050, 1920x1200
- 15:9 - 1280x768
- 16:9 - 1280x720, 1920x1080
- Surround - 1920x480, 2400x600, 3072x768, 3840x1024
Looking at the graph, there are four "areas" of pixel count. There are:
- 1M: These are the resolutions with less than 1M (1,024,000) pixels. This covers the resolutions between 1024x768 and 1280x800. These are all considered very low end resolutions, and covers most of the 720p HDTV world
- 1M - 1.5M: This small band covers 1440x900 - 2400x600. This is the low end of mainstream. The first "stand alone" widescreen resolution is here (1440x900), as well as the venerable 5:4 LCD resolution of 1280x1024.
- 1.5M - 2.5M: While the "slope" of the first two bands was relatively flat. Graphing these resolutions shows a more rapid increase in the pixel count. This covers the more mainstream resolutions of 1680x1500 and 1920x1200, as well as 1080p HDTV.
- 4M: This is the ultra high-end. This range covers the high end of Surround (3840x1024) and Widescreen (30" 2560x1600). Both of these resolutions clock in right at 4M pixels.
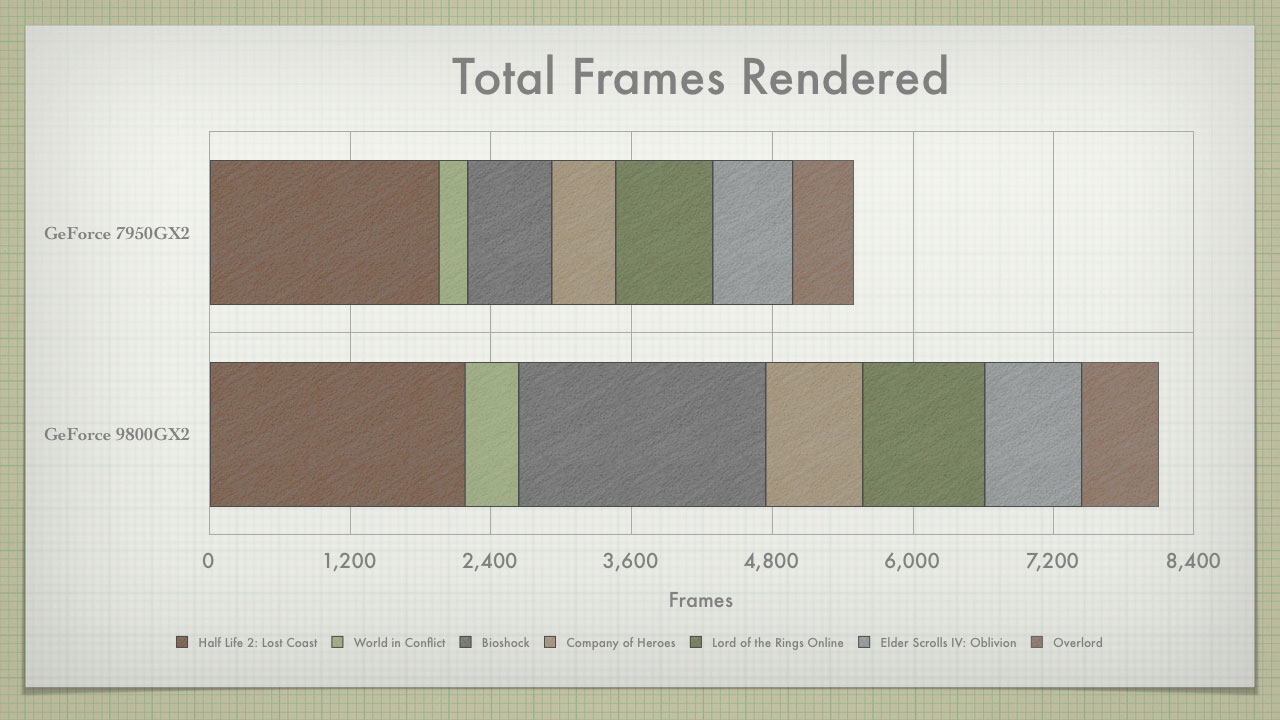
Total Frames Pushed
I saw this type of chart used somewhere else, and I thought it was interesting. This shows the total about of (average) frames pushed though each game, at each resolution. These charts show that the 9800GX2 delivers a sizable performance increase over the 7950GX2 (as we would expect). The first chart shows us that the much of the growth comes in games like World in Conflict and Bioshock, and not from games like Half Life 2.
Looking at the second chart, we can then see where the improvement comes in for each game. We can easily see that Bioshock is seeing significant improvements across the board, but Half Life 2 only picks up significant improvements at the top resolutions. And while World in Conflict only pics up 250 frames in total, it is almost double the previous performance.