NVIDIA GeForce GTX275 896MB vs. 1792MB Review
This article is the first round of GTX 200 benchmarks I'm working on. I was fortunate enough to get in touch with the fine folks at EVGA, and inquired about borrowing some cards for benchmarking and evaluation. They agreed, and this look at the GTX 275 is the first round of what will be an ongoing series of benchmarks and testing.
As of now, my rig stands at:
- BFG GTX 295 ForceWare 182.50 (last version to natively support Wide Surround modes)
- EVGA X58 Tri-SLI Motherboard
- Intel i7 920 at 4x2.67GHz
- 6GB G.Skill DDR3 RAM
- 2x Samsung 320GB T-Series HDD (one for the OS and games; one for swap file and FRAPS)
- LG Super Multi Blu (HD-DVD/Blu-Ray Player)
- Onboard audio
- Enermax Infiniti 720W
- Antec Skeleton
- Dell 3007WFP
- Matrox Digital TripleHead2Go
- 3x Dell SP2008WFP
- Logitch G15 Keyboard & G5 Mouse
Guru3D recently posted a review of the EVGA GTX 275 1792MB edition. Their findings were that the higher frame buffer only provided a benefit at 2560x1600 with extreme amounts of AA. There are a few differences in their testbed. One, they are using a Core i7 965 and thus have more CPU headroom. Two, they are using newer drivers. We are stuck at 182.50, due to issues with Wide Surround modes in newer drivers. And finally, their testing tops out at 2560x1600.
Moving to 5040x1050 Wide Surround (from 16:10 2560x1600) adds approximately 37% to your FOV (adding more objects to render), and adds another 1.3M pixels (a 32% increase over 2560x1600). Thus, we have a greater possibility to see a benefit in Surround and Wide Surround, even without extreme amounts of AA.
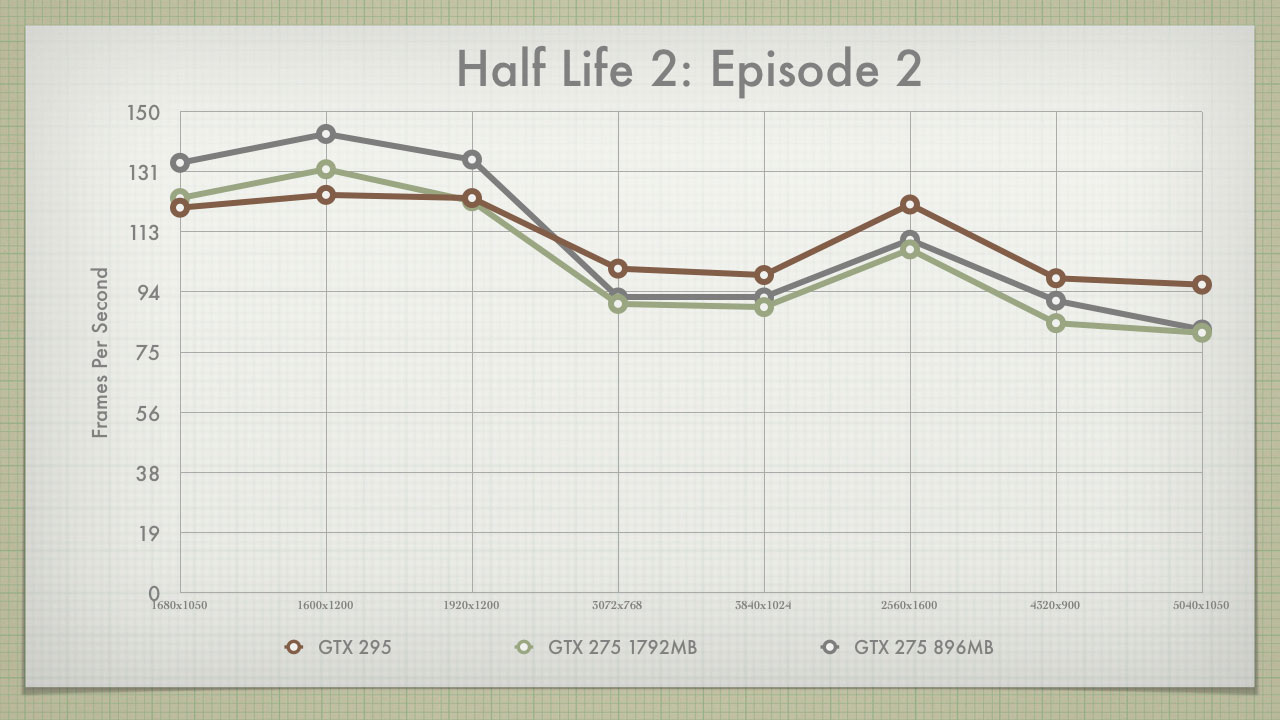
Half-Life 2: Episode 2
From the HardwareOC Bench HL2 Ep2 benchmarking tool, with max quality settings. This was run with three passes, taking the average of the three. Results between the three runs were very consistent. The GTX 275 cards actually outperform the GTX 295 at 1920x1200 and below. The GTX 295 begins to overtake the mid-range card in Surround, Wide Surround and the 30" panel range.
However, the performance of the GTX 275 is still outstanding for Source Engine games, and would perform quite well. This further proves that the GTX295 is overkill if you're main games are using the Source Engine (like TF2). Looking at the two GTX cards, they traded top billing along the resolution axis. There is no need for the bigger card in this situation.
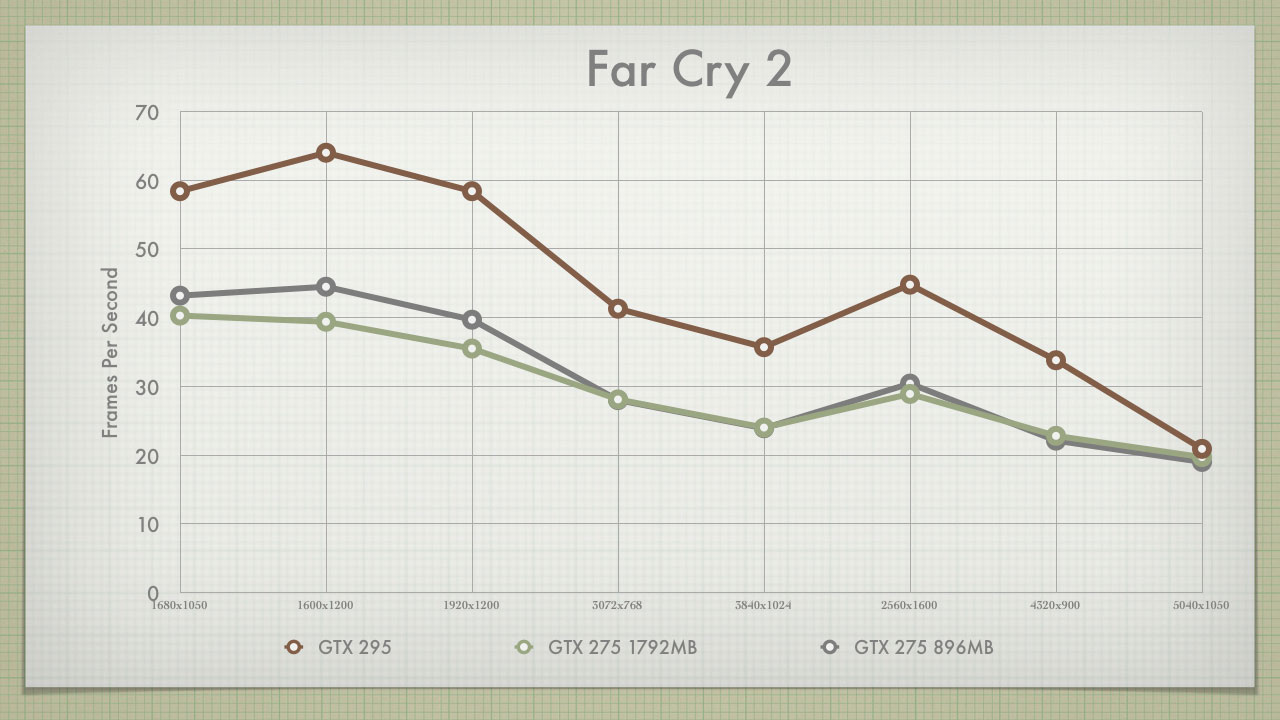
NVIDIA GeForce GTX275 896MB vs. 1792MB Review - Far Cry 2
Built-In Benchmarking Tool. This was set to the "Ultra" settings with 4xAA. This was run on the "Ranch Long" run, with an average of three passes. Results between the three runs were very consistent. Higher resolutions take a consistent toll on performance, and higher aspect ratios take an ever bigger toll. The GTX 295 consistently outperforms the GTX 275 at all resolutions except 5040x1050. Now remember this is at Ultra settings with 4xAA.
Knocking back the graphics quality to "High and 4xAA" will net you just under 30fps with both GTX 275s, and just over 30fps with "High and 2xAA." Turning AA off puts you above 40fps in "High," and at 30fps in "Very High." The two cards continue to perform within a couple points of each other. I ran a matrix of benchmarks to show how the card performs at different combinations of quality and anti-aliasing.
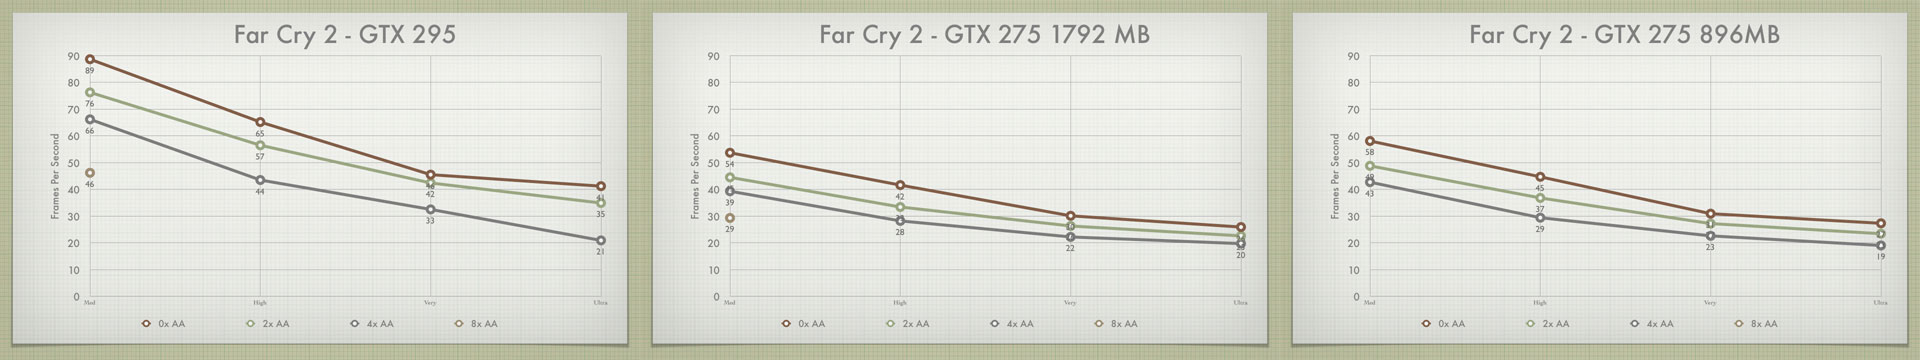
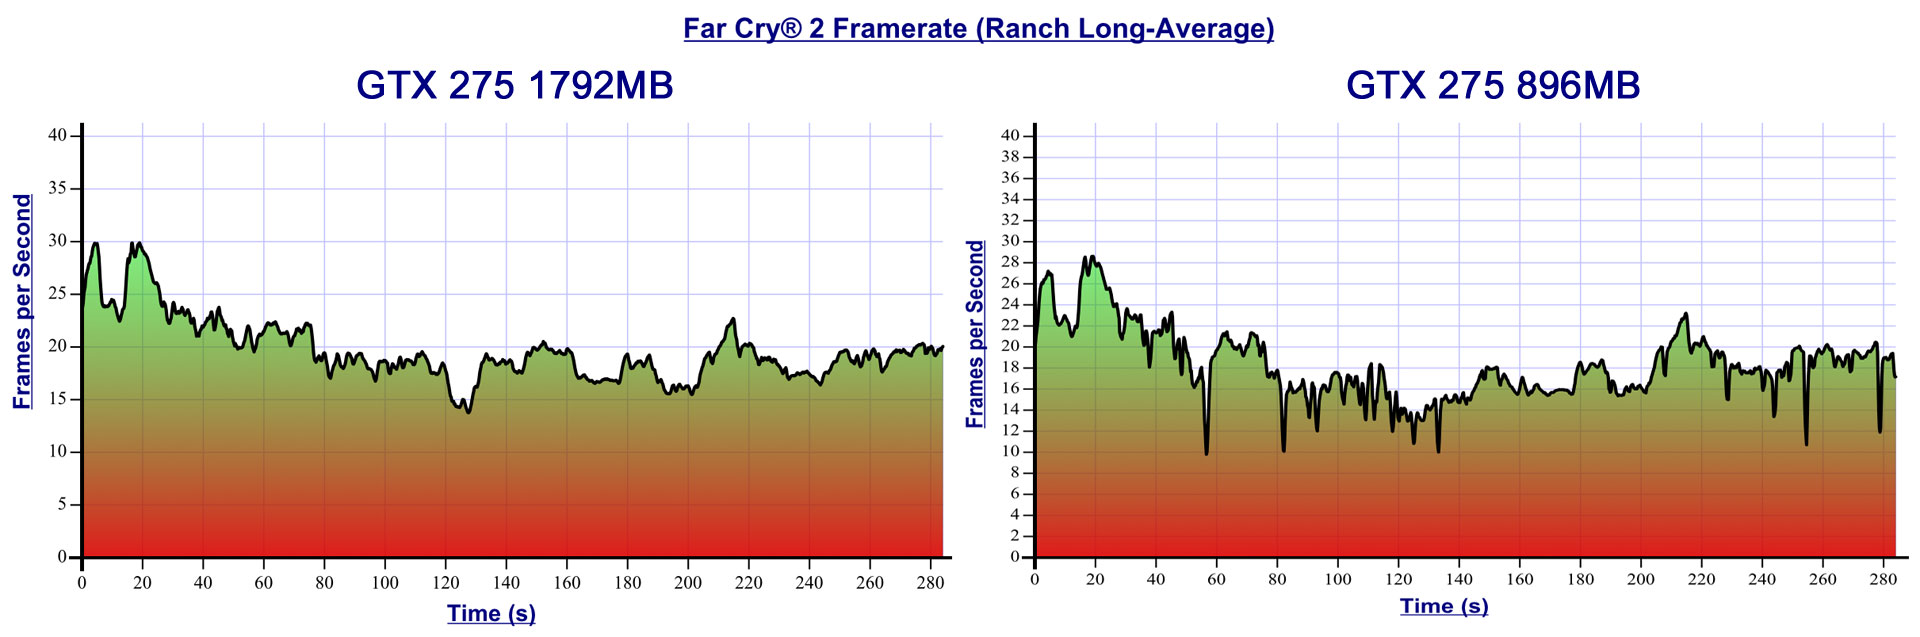
At lower resolution levels, the GTX 275 896MB somehow outperforms the 1792MB card by a few points. This draws to neck-and-neck performance at 5040x1050. In reality the 1792MB card averages 19.7fps, and the 896MB card averages 19.0fps. While this may sound like a negligible difference, looking at the detailed performance tells a different story.
As you can see in the graph below, the 896MB card hiccups at several points in the benchmark as it swaps textures in and out of memory. The 1792MB card does not suffer this hindrance. While the overall average only shows a .7fps gain for the 1792MB card, the overall performance is much smoother. We see this phenomenon at 2560x1600 and 3840x1024 as well.
NVIDIA GeForce GTX275 896MB vs. 1792MB Review - Trackmania Nations & World in Conflict
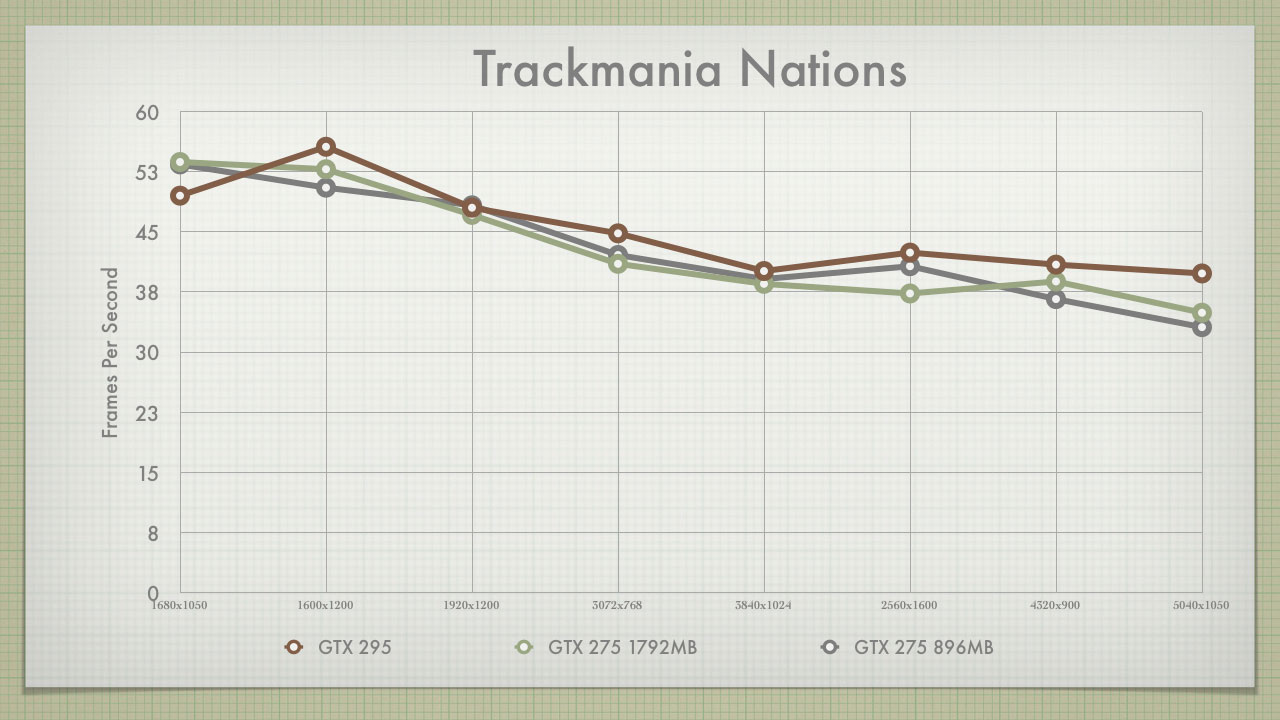
Trackmania Nations
Built-In Benchmarking Tool. I set every graphics slider to the maximum, and toggled every available option to be "on." I set AA at 4x. I ran four consecutive runs through the built in tool. I threw out the first, and averaged the last three. There was some minor variability within the three passes.
Both GTX 275 cards offer similar performance to the GTX 295. Considering the small variance run-to-run, individual scores from all three cards often overlapped each other. If Trackmania is your game, there is little if any reason to go above the entry level GTX 275.
World in Conflict
Built-In Benchmarking Tool. The game and benchmarking tool have seen significant updates since my last test session. There are multiple new options available for additional detail, particles and effects. Everything was set to max quality, and every option turned on. Based on these new options, these results cannot be directly compared to my first WIC run (even considering the OS difference).
I ran four consecutive runs through the built in tool. I threw out the first, and averaged the last three. Initially I hadn't been able to benchmark in Vista, as it defaulted to DX10 (which crashes in Surround). After figuring out the manual edit I was able to run in DX9 mode. There was some minor variability within the three passes.
The GTX 295 is the top performer across the board, and provides a significant boost at 2560x1600. However, at lower resolutions the GTX 275 1792MB card provides comparable performance. The larger GTX 275 does provide a noticeable difference over it's smaller companion, at each resolution. This difference is quite pronounced at 5040x1050, with the GTX 1792MB pulling numbers close to the GTX 295.

NVIDIA GeForce GTX275 896MB vs. 1792MB Review - Conclusions
Other Benchmarks
I had hoped to use the benchmark tool in HAWX, as the game has excellent support for Widescreen and Wide Surround. But the game produced hugely variable numbers between runs. Where Trackmania and World in Conflict may produce variances of 3-4 fps against an average of 30-40 fps (roughly 10%), HAWX was producing variances of 20-30 fps against an average of 100fps (20%-30%). I simply didn't have the time to work it to consistent readings.
Also, I could not get Crysis Warhead to bench under Vista. Initially the game would run and bench, but would dump back to the desktop without producing or saving any results. I could watch the average fps count as the game finished each pass, but this would be a pain and defeat the purpose of a self-running demo. I attempted to fix the problem by deleting the game and the benchmark tool, and reinstalling both. The game wouldn't run at all after this.
Hopefully I can get these issues worked out for future iterations.
Conclusions
The GTX 275 performs extremely well, and is a hell of a value. However, there are some instances where the GTX 295 is a clear winner. For older titles based on the Source Engine, the GTX 275 is certainly in the sweet spot - and you avoid the issue of the GTX 295 whine.
The GTX 275 carries enough power to run a 30" panel, or a TH2Go rig in either Surround or Wide Surround. The larger frame buffer does provide a benefit, particularly at 5040x1050. At mid-range resolutions the benefit may simply be a smoother experience, with less hiccups for texture swapping.
I already own a GTX 295 (bought the day of release, well before the GTX 275 was available). However, if I were looking to purchase now, I would choose the GTX 275 1792MB over the GTX 295. Tweaking a few settings off of "max" should give you solid frame rates with the GTX 275 in most any situation, and you avoid the GTX 295 whine.
What's Next?
I've sent back the GTX 275 896MB card, and EVGA has agreed to send me a 2nd GTX 275 1792MB card. I will run through all of the benchmarks with the GTX 1792MB cards in SLI. After that I look forward to tackling the GTX 285 series, of which EVGA offers both 1GB and 2GB models. At the end, we should be able to provide a nice matrix of price and performance across Widescreen, Surround and Wide Surround.
Also, I will be dropping tests for 1680x1050, 1600x1200, 3072x768 and 4320x900.
- We see consistent performance across 1680x1050, 1600x1200 and 1920x1200. There is no longer any need to run these separately, and we have already proven the impact of aspect vs. pixels in the original Widescreen and Surround Benchmarking Suite.
- Additionally, we see comparable performance for the "Normal" Surround modes of 3072x768 and 3840x1024, so there is no added value in testing both.
- Finally, while we do see some performance difference in the Wide Surround modes of 4320x900 and 5040x1050; most users are only interested in the seeing benchmarks for their native resolution of 5040x1050.
This will leave us with the native resolutions for the most popular panels 1920x1200 (24"+), 2560x1600 (30"), 3840x1024 (Surround) and 5040x1050 (Wide Surround). These changes will make the future charts easier to read (as we add more cards), and reduce the time it takes for each round of benchmarking.