Gaming CPU Shoot-Out Redux: Multi-GPU Scaling
Introduction
| Price | Cores | Clock | |
| AMD FX-9590 | $229 | 8 | 4.7 GHz |
| AMD FX-9370 | $209 | 8 | 4.4 GHz |
| AMD FX-8350 | $179 | 8 | 4.0 GHz |
| AMD FX-6350 | $139 | 6 | 3.9 GHz |
| AMD FX-4350 | $99 | 4 | 4.2 GHz |
Late last year I performed a massive 10-Way CPU Shootout. It looked at 10 different CPUs, each tested with three different GPUs. Each configuration was tested in 1080p HD and Eyefinity, across three games. Sum total it was 180 different tests.
My findings from that article were as such:
Widescreen - 1080p HD
- There is absolutely no performance improvement to be had on a single HD screen, when paired with a Radeon R7 260X.
- There are minor performance improvements in 1080p HD, when paired with a Radeon HD R9 270X. These improvements peak at the R9 270X, with no improvements beyond that.
- There are noticeable improvements in performance with CPUs, when paired with the R9 280X. These hit a plateau around the FX-6350 or the FX-8350, with some small performance improvements in the Intel Core processors.
Eyefinity - 3x 1080p HD
- There is absolutely no performance improvement to be had in an Eyefinity or Surround configuration, when paired with any single GPU
General Observations
- There is no need for a Core i7-2600k, for gaming. This processor offers no realistic performance improvements in games, and cost significantly more than other chips.
- The "sweet spot" for CPUs seems to be at the AMD FX-6350 or Intel i3-2130
- There is good money to be saved in CPU purchase that can go into a better or 2nd GPU, or an SSD, etc.
Redux - The Update
| Geekbench 3 | Cinebench 11 | |||||||||||
| 32-bit | 64-bit | 32-bit | 64-bit | |||||||||
| Single | Multi | Single | Multi | Single | Multi | Single | Multi | |||||
| AMD FX-9590 | 2,555 | 12,941 | 2,836 | 13,980 | 1.17 | 7.51 | 1.25 | 7.76 | ||||
| AMD FX-9370 | 2,415 | 12,125 | 2,685 | 13,180 | 1.11 | 6.98 | 1.18 | 7.28 | ||||
| AMD FX-8350 | 2,215 | 11,820 | 2,448 | 12,752 | 1.03 | 6.60 | 1.10 | 6.86 | ||||
| AMD FX-6350 | 2,205 | 8,905 | 2,461 | 9,733 | 1.02 | 4.79 | 1.09 | 5.01 | ||||
| AMD FX-4350 | 2,256 | 6,642 | 2,529 | 7,273 | 1.04 | 3.43 | 1.11 | 3.56 | ||||
For that article I tested a wide array of CPUs - three Intel CPUs (an i3, an i5, and an i7), four AMD FX CPUs, and three AMD APUs. It was a very wide range of processing units, but they were each only tested with one GPU (AMD R7 260X, R9 270X, and R9 280X).
At the time I didn't yet have my R9 290, nor did I have second video cards to create CrossFire configurations of the original three GPU options. And even with the range of CPUs that I had, I didn't have anything truly high-end.
Since that article I've sold my Intel rig. I've been able to source FX-9370 and FX-9590 CPUs, to look at the top end of the AMD processor stack. I've also been able to source an AMD Radeon R9 290 (no X), as well as the additional cards needed for CrossFire configurations.
The AMD FX-9590 was released into retail this past summer, available with and without a custom closed loop liquid cooler from Cooler Master. Given the now wide scale retail availability of both the FX-9370 and the FX-9590, it seemed like a good time to put the finishing touches on a new article.
So, we'll revisit the original premise, but with updated hardware. Is a higher end CPU needed to unlock the power of an R9 290, or the power of a CrossFire configuration. Or, is money still better saved on a CPU to upgrade video cards or purchase an SSD (which are cheaper than ever).
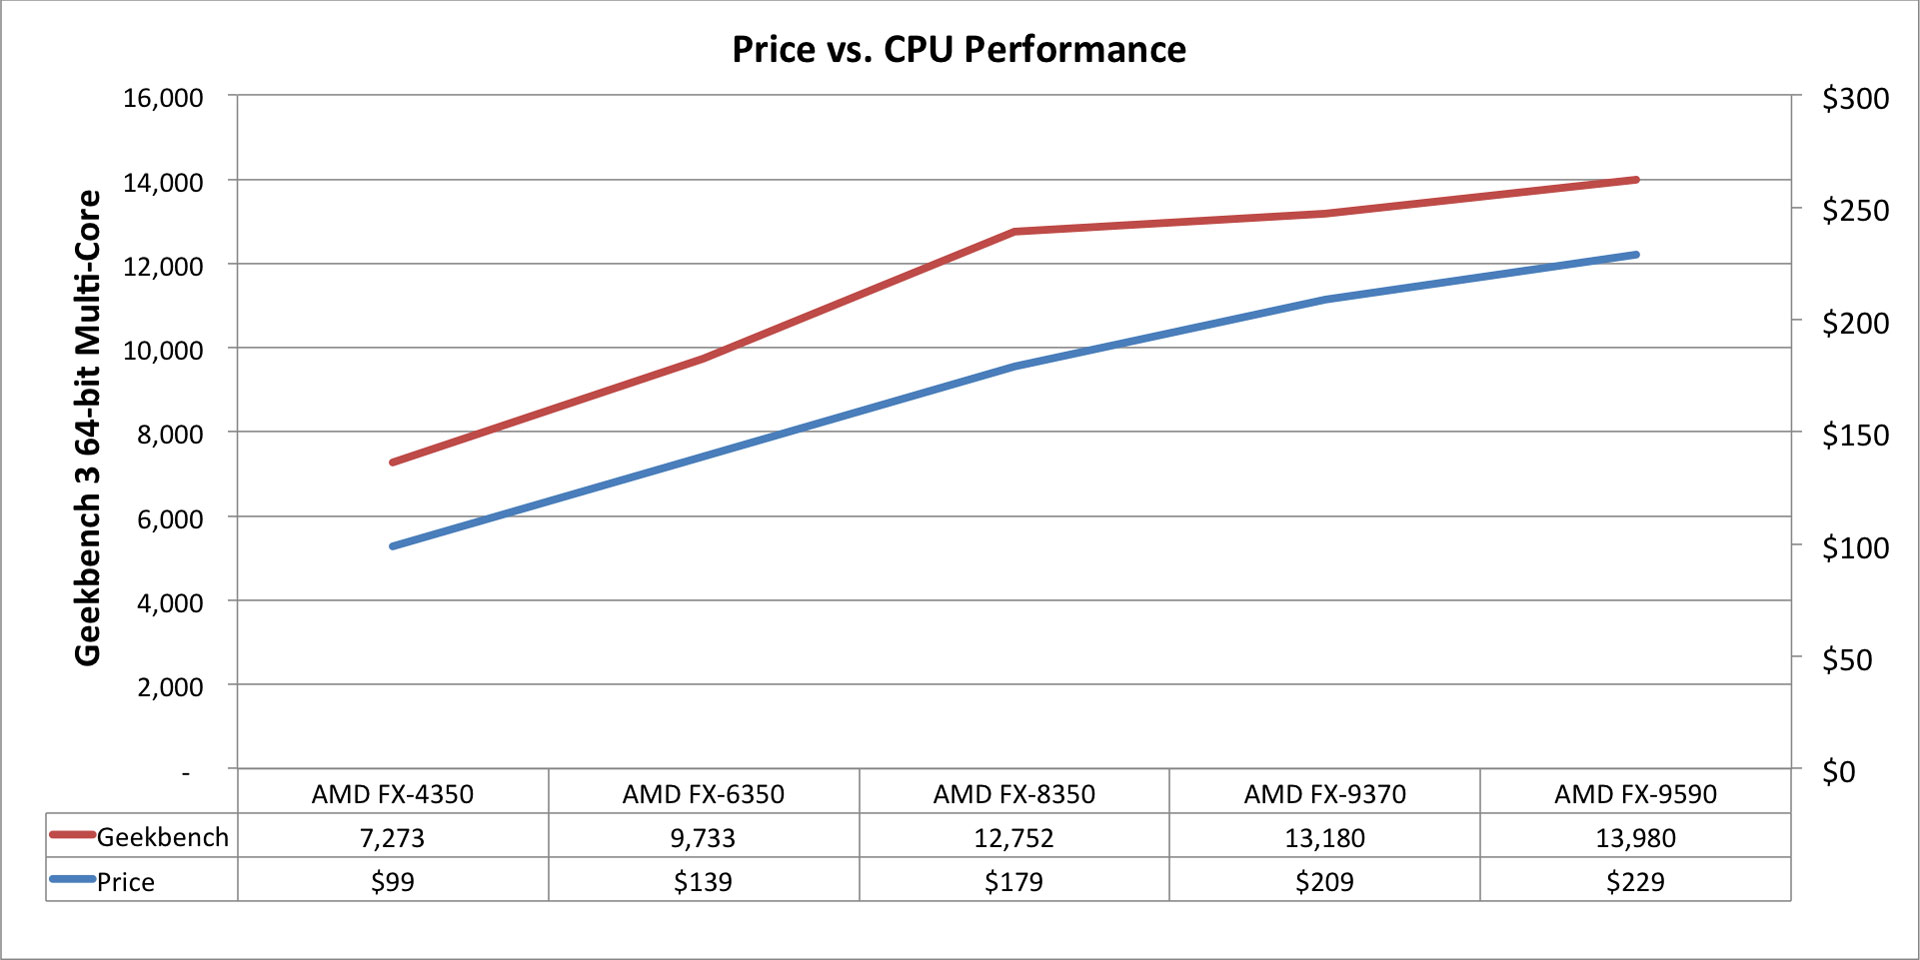
As before we'll start the review with a look at raw CPU power, and compare that to processor prices. Since their original launch, the AMD FX-9370 and FX-9590 have dropped significantly in price. (Prices here are without the custom closed loop water cool option offered by AMD).
At this point, AMD has a pretty linear price line from the FX-4350 ($99) through the FX-9590 ($229). Pricing advances $40 for each step between the FX-4350, FX-6350, and FX-8350. From there the price increases slow to a $30 increase for the FX-9370 and then $20 more for the FX-9590. While the price rises at a fairly linear rate, the Geekbench results only match this line slope through the FX-8350 (and actually provide a better price/performance ratio at the FX-8350). For the FX-9370 and the FX-9590, the performance largely flattens out - while the price continues to gradually rise.
Benchmarking
The previous project was weeks in the testing. For this redux I tested each of the five processors across three games, each of those across seven GPU configuration, in both 1080p HD and Eyefinity 3x 1080p HD. This results in a ton of tests - 210 to be exact (5 x 7 x 3 x 2). Thirty more tests than the first article
Each CPU was tested at stock clock speeds, with 16GB of RAM in Dual-Channel configuration. Everything was run on air cooling in an open "benchtop case". The cooler is a Zalman Ultra Quiet CNPS 9900DF (Dual Fan). It is rated for 300W TDP. The GPUs were also run at stock clock speed. I ran Windows 8.1, off of a 512GB Crucial M4 SSD.
I used FRAPS to capture frame rates for each game, running each test three times (so it was actually 630 runs). In the graphs below, the top of each segment of the stacked bar represents the value at hand.
The top of the red bar is the minimum. The top of the blue bar is the average. And the top of the purple will be the max. Taller blue sections show a higher minimum frame rate. And a thinner red section shows a tighter correlation between the minimum and the average. Both of these are positive trends to find. Remember that minimum and maximum values may only show up once or twice in a run. Or, they may be indicative of difficult parts of the test.
Metro Last Light and the Unigine Valley test have sections that are much more difficult than those around them. These represent an actual taxing of the system. A test such as DiRT: Showdown is fairly consistent throughout the test.
Gaming CPU Shoot-Out Redux: Multi-GPU Scaling - Metro Last Light
Metro Last Light
For Metro Last Light I used the be built-in benchmarking tool. The test was run at "Very High" quality, with AF 16X texture filtering, Low motion blur and Normal tessellation. I run these settings on the benchmark run for three loops. I used FRAPS to capture the performance data of the third and last loop.
1080p Widescreen
| Metro Last Light - 1080p HD | Metro Last Light - 1080p HD CrossFire | |||||||||||||||||||||||||||
| R7 260X | R9 270X | R9 280X | R9 290 | R7 260X CFX | R9 270X CFX | R9 280X CFX | ||||||||||||||||||||||
| Min | Avg | Max | Min | Avg | Max | Min | Avg | Max | Min | Avg | Max | Min | Avg | Max | Min | Avg | Max | Min | Avg | Max | ||||||||
| AMD FX-9590 | 20 | 28.0 | 44 | 27 | 40.4 | 65 | 34 | 54.5 | 90 | 44 | 68.0 | 99 | 29 | 44.0 | 67 | 37 | 58.1 | 87 | 40 | 69.8 | 108 | |||||||
| AMD FX-9370 | 19 | 28.1 | 44 | 27 | 40.4 | 66 | 34 | 54.9 | 91 | 44 | 68.0 | 98 | 28 | 43.7 | 67 | 36 | 57.8 | 85 | 37 | 68.7 | 104 | |||||||
| AMD FX-8350 | 18 | 27.1 | 43 | 25 | 36.9 | 60 | 34 | 53.0 | 84 | 39 | 66.8 | 96 | 28 | 41.2 | 66 | 36 | 57.3 | 87 | 35 | 68.2 | 111 | |||||||
| AMD FX-6350 | 17 | 27.0 | 43 | 25 | 36.9 | 60 | 29 | 52.5 | 82 | 37 | 64.2 | 96 | 21 | 35.9 | 55 | 30 | 55.6 | 82 | 29 | 62.9 | 101 | |||||||
| AMD FX-4350 | 18 | 27.1 | 43 | 23 | 36.1 | 59 | 23 | 49.5 | 75 | 24 | 53.1 | 80 | 18 | 37.5 | 54 | 18 | 45.2 | 71 | 23 | 47.2 | 74 | |||||||
In single GPU configurations, an R7 290X is needed for the average to stay above 30fps. All of the processors basically allow for a max of 60fps. The R9 290 is needed for an average of 60fps. With the R9 280X and the R9 290, you can see the performance improve steadily with each processor.
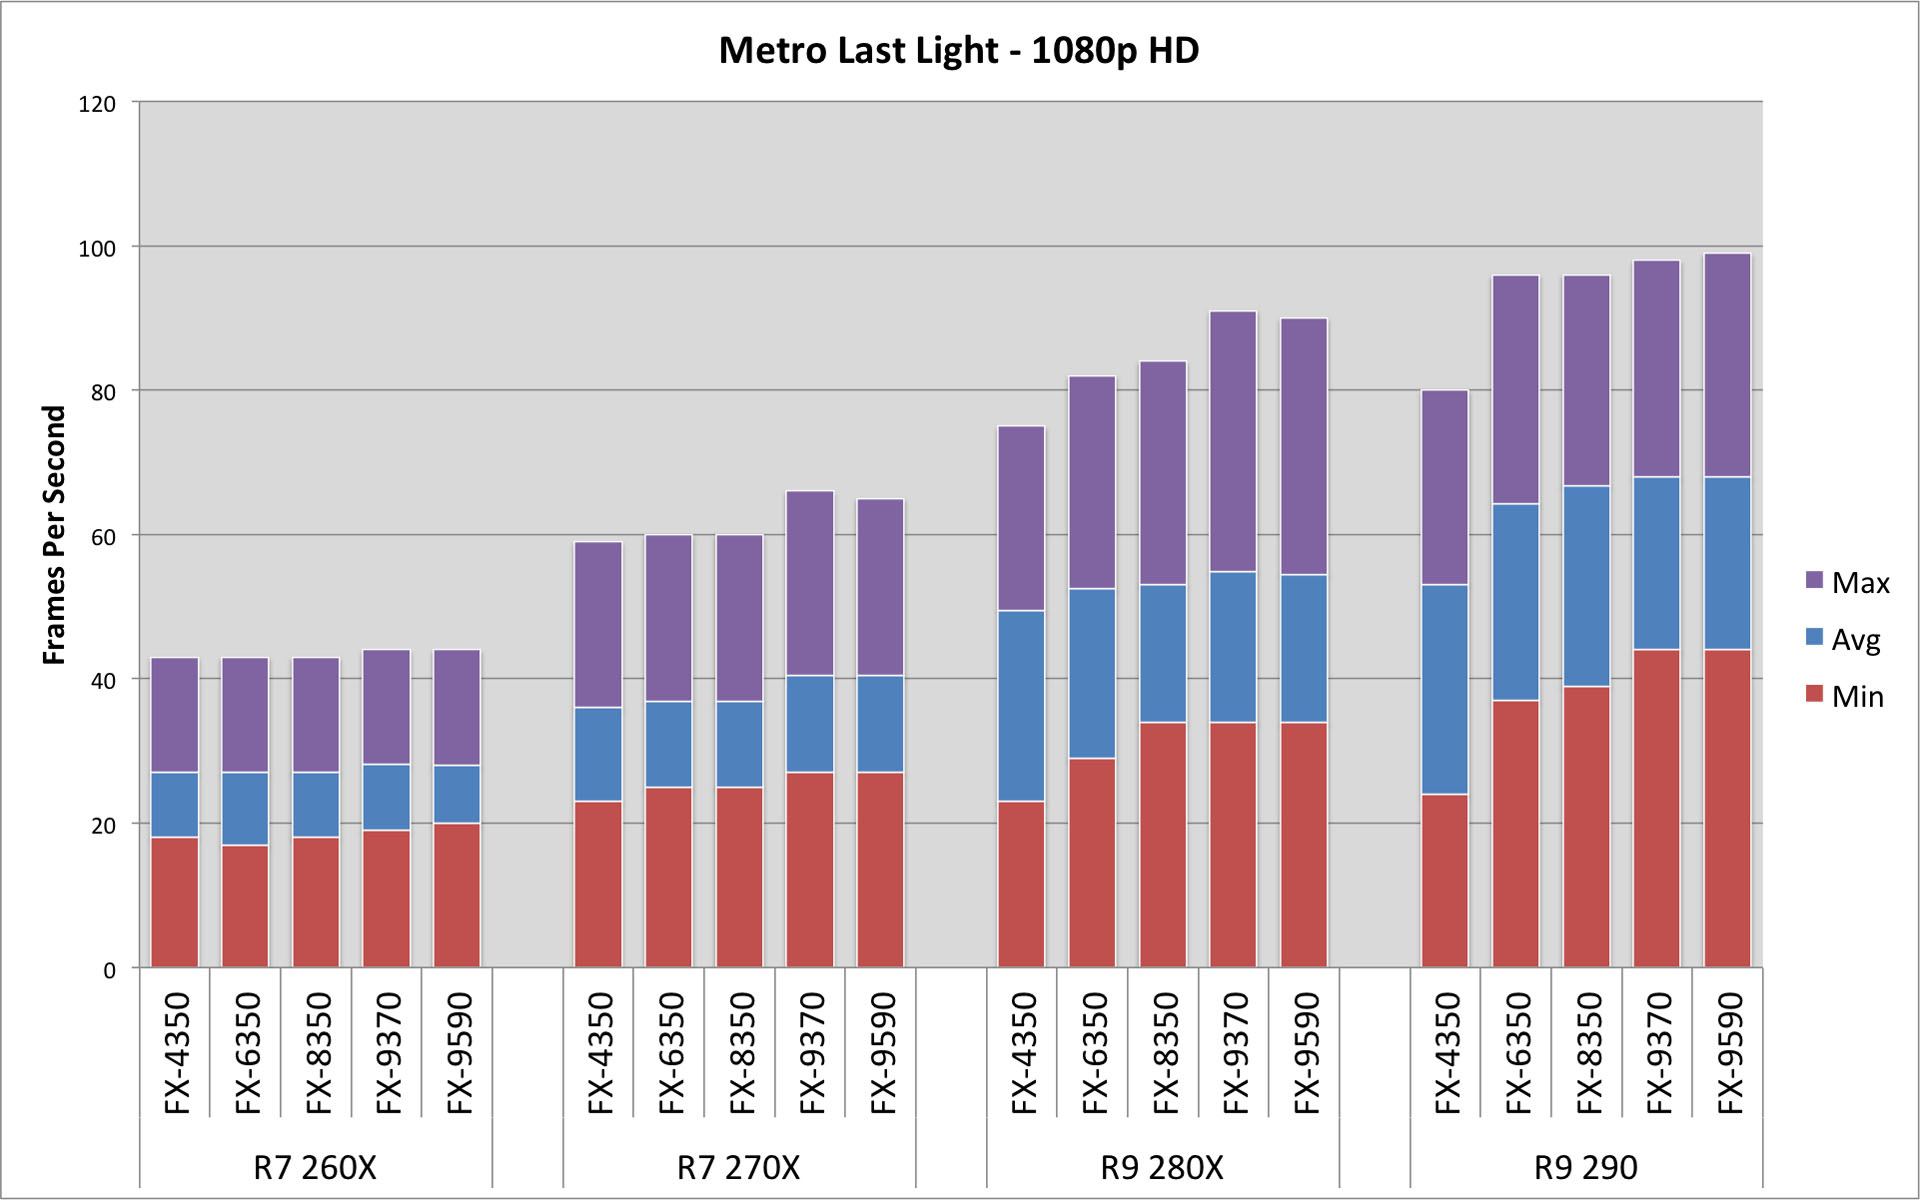
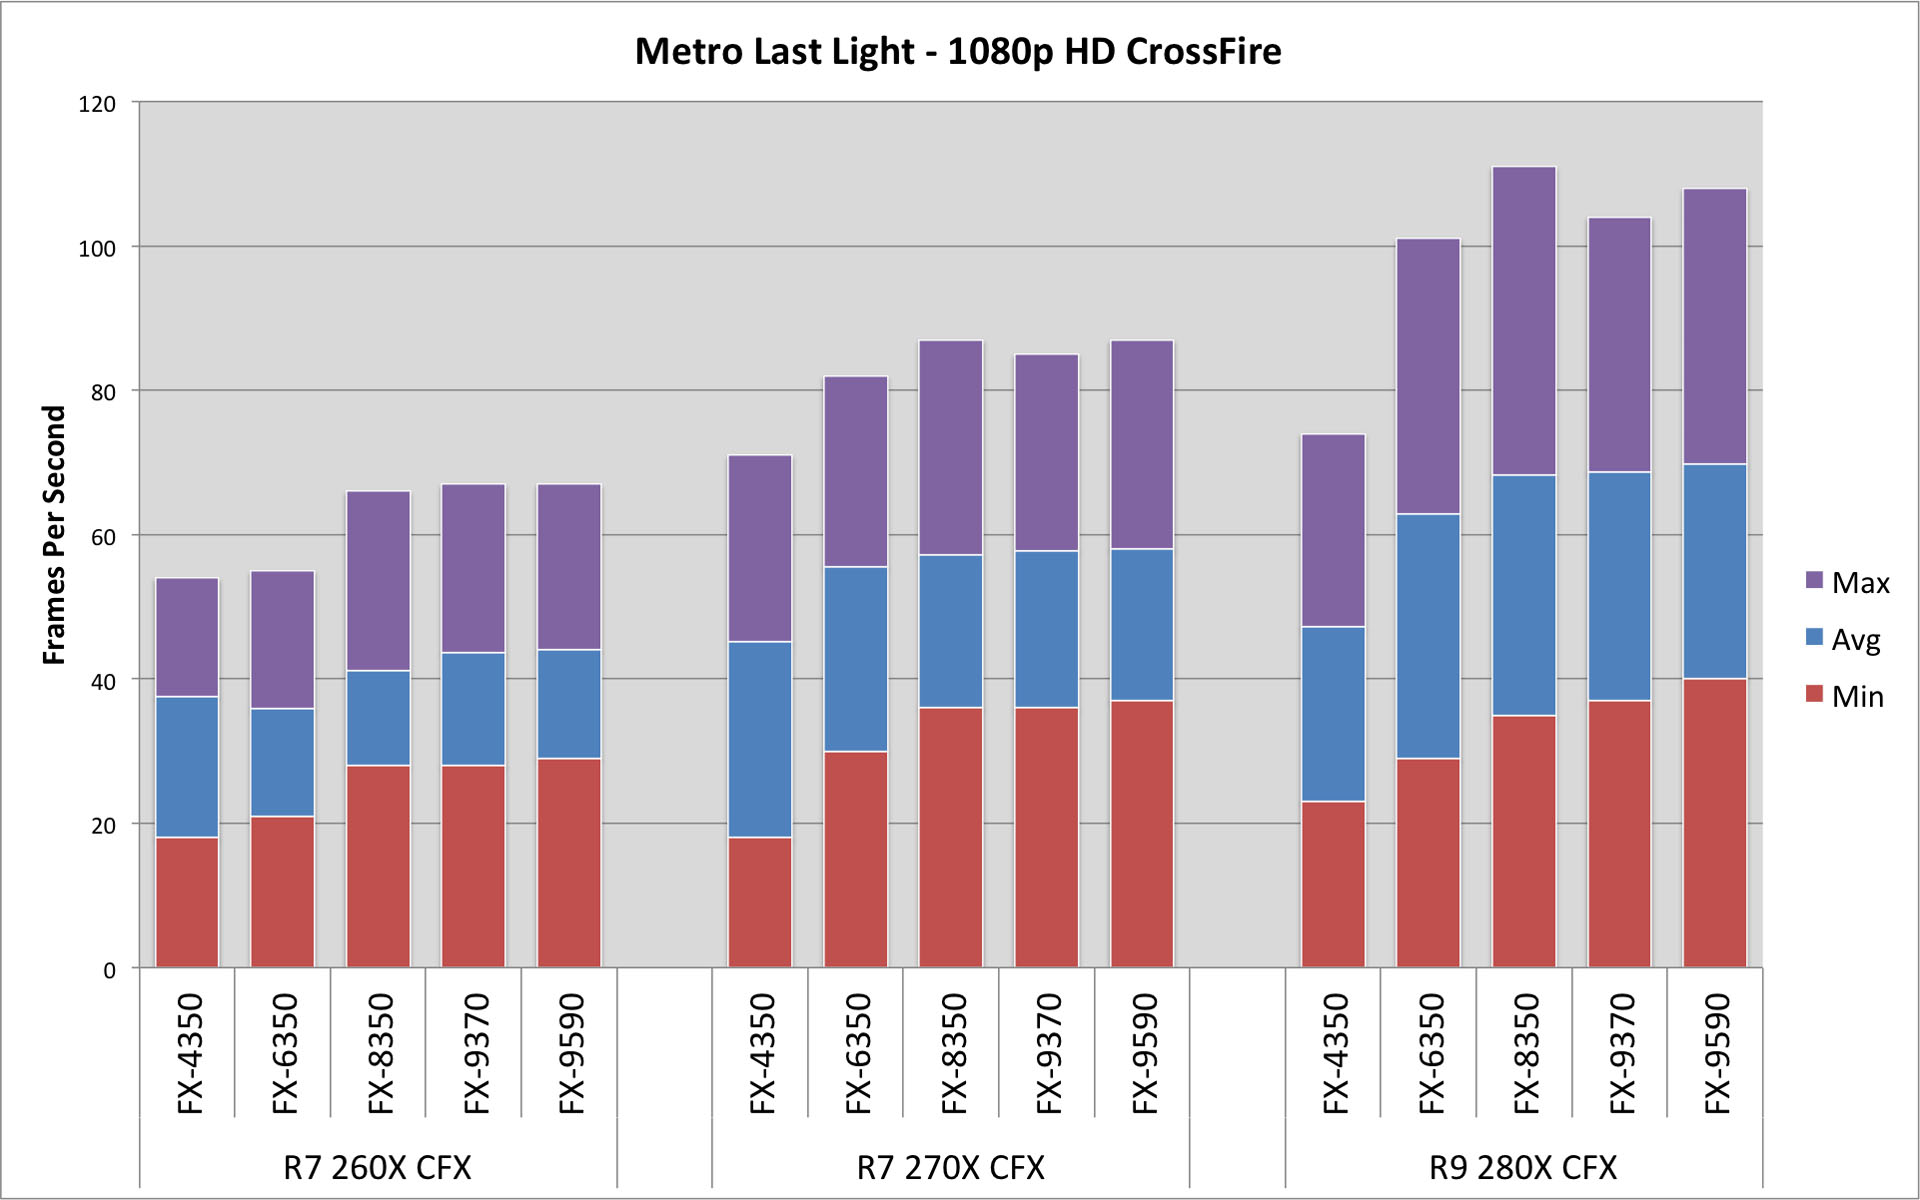
In CrossFire, the FX-4350 holds back performance - especially with a pair of R9 280X cards. Assuming you have the funds to run a pair of those, I would assume a better CPU is already on your radar. There are marked improvements for an FX-8350 in each configuration, with the two faster chips not offering any better (and sometimes worse) performance.
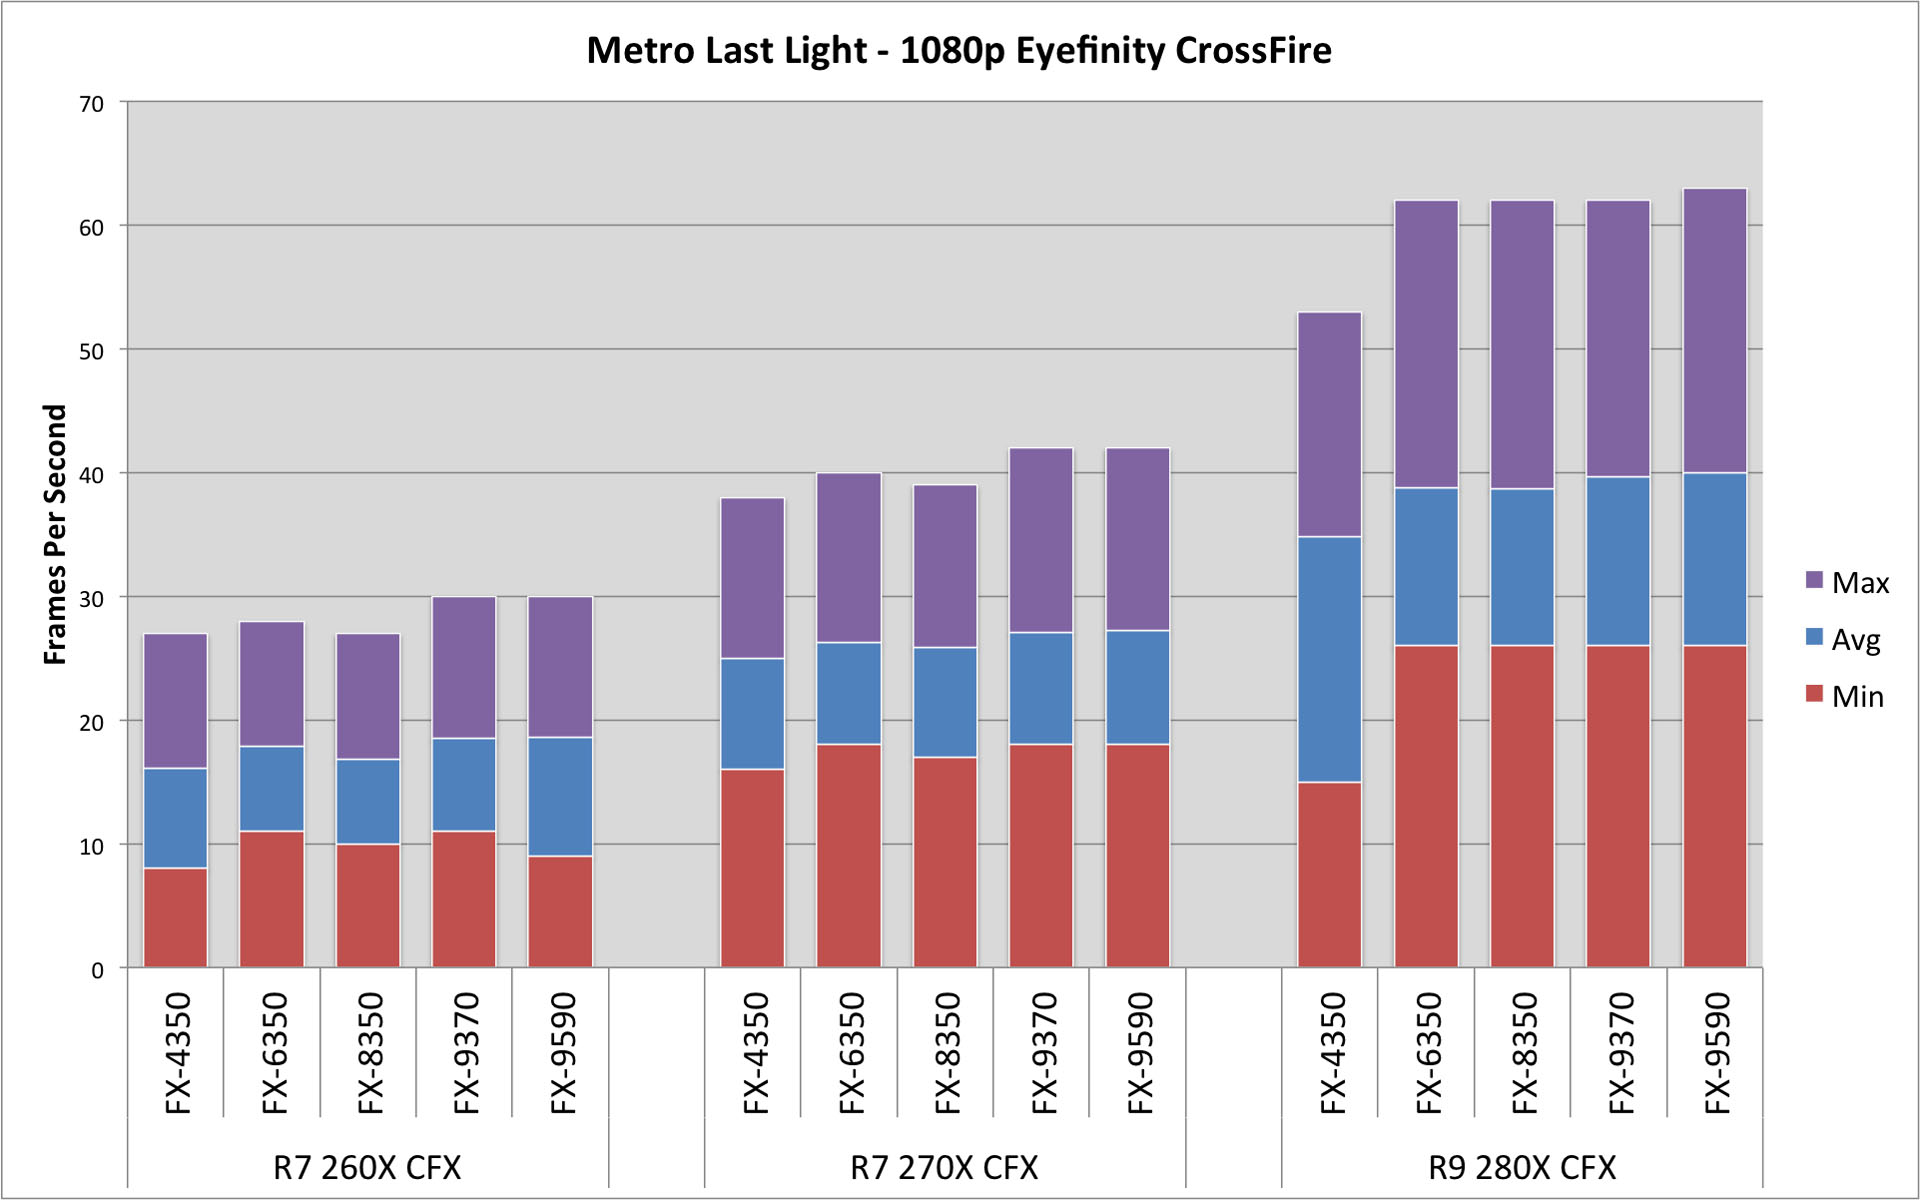
1080p Eyefinity
| Metro Last Light - Eyefinity | Metro Last Light - Eyefinity CrossFire | |||||||||||||||||||||||||||
| R7 260X | R9 270X | R9 280X | R9 290 | R7 260X CFX | R9 270X CFX | R9 280X CFX | ||||||||||||||||||||||
| Min | Avg | Max | Min | Avg | Max | Min | Avg | Max | Min | Avg | Max | Min | Avg | Max | Min | Avg | Max | Min | Avg | Max | ||||||||
| AMD FX-9590 | 7 | 11.2 | 16 | 11 | 16.8 | 24 | 18 | 24.9 | 36 | 23 | 30.7 | 44 | 9 | 18.6 | 30 | 18 | 27.2 | 42 | 26 | 40.0 | 63 | |||||||
| AMD FX-9370 | 7 | 11.1 | 16 | 11 | 16.9 | 24 | 18 | 24.8 | 36 | 24 | 30.8 | 44 | 11 | 18.5 | 30 | 18 | 27.1 | 42 | 26 | 39.7 | 62 | |||||||
| AMD FX-8350 | 7 | 11.1 | 16 | 10 | 15.3 | 22 | 16 | 24.1 | 36 | 22 | 30.0 | 43 | 10 | 16.8 | 27 | 17 | 25.9 | 39 | 26 | 38.7 | 62 | |||||||
| AMD FX-6350 | 7 | 11.0 | 16 | 9 | 15.3 | 22 | 16 | 24.2 | 36 | 22 | 30.3 | 43 | 11 | 17.9 | 55 | 18 | 26.3 | 40 | 26 | 38.8 | 62 | |||||||
| AMD FX-4350 | 8 | 11.0 | 16 | 10 | 15.3 | 22 | 16 | 23.8 | 35 | 18 | 30.4 | 44 | 8 | 16.1 | 27 | 16 | 25.0 | 38 | 15 | 34.8 | 53 | |||||||
As we saw in the previous article, Eyefinity performance on a single GPU is absolutely tied to the GPU. Average and max frames are basically in a dead heat across all the configurations, with the only improvements being 1-2 fps. There are some noticeable improvements in minimum fps produced with a better CPU - but only on an R9 290.
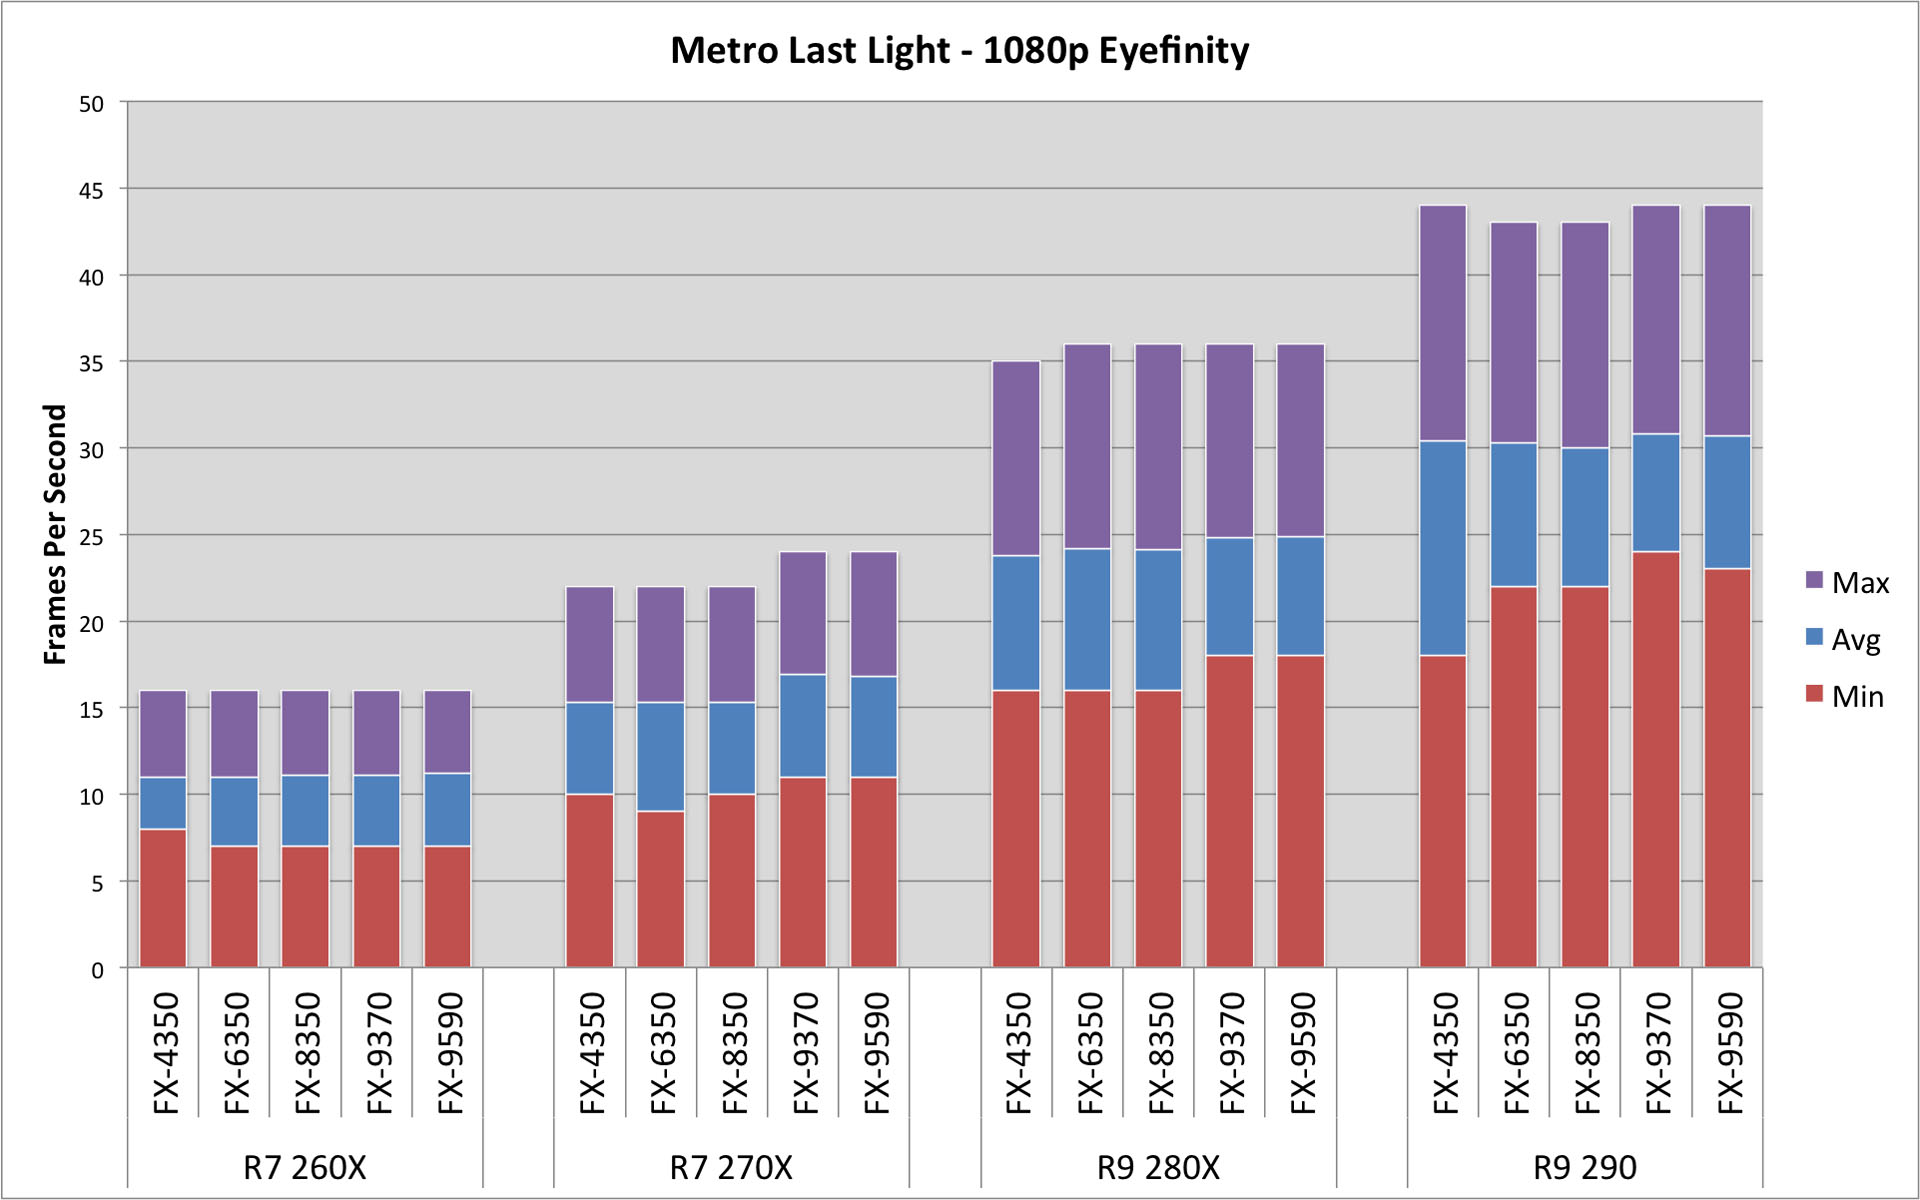
CrossFire is largely the same story - performance is tied to the GPU. The one stand out difference is the FX-4350 with a pair of R9 280X cards. The low end CPU certainly holds back the power of the cards. But on the other hand, the higher end CPUs don't offer any performance gains over each other.
Gaming CPU Shoot-Out Redux: Multi-GPU Scaling - DiRT: Showdown
DiRT: Showdown
DiRT Showdown was tested at the Ultra setting pre-set, with 4X MSAA enabled. The test was run three separate times, with the testing done on the third pass. FRAPS was manually started with the benchmark fly-by of the track. It was subsequently stopped right before the car crossed the finish line, prior to the slow motion scene of the finish.
Please note that the DiRT Showdown test is not a canned demo like Metro Last Light or Unigine Valley. It is a sample race in a figure-eight style track. The cars jockey for position with the driver AI, and each run is inherently different.
Small variances between runs should be discounted, due to this variation between the actual tests. I did toss out any test run that had any crashes or a stuck car.
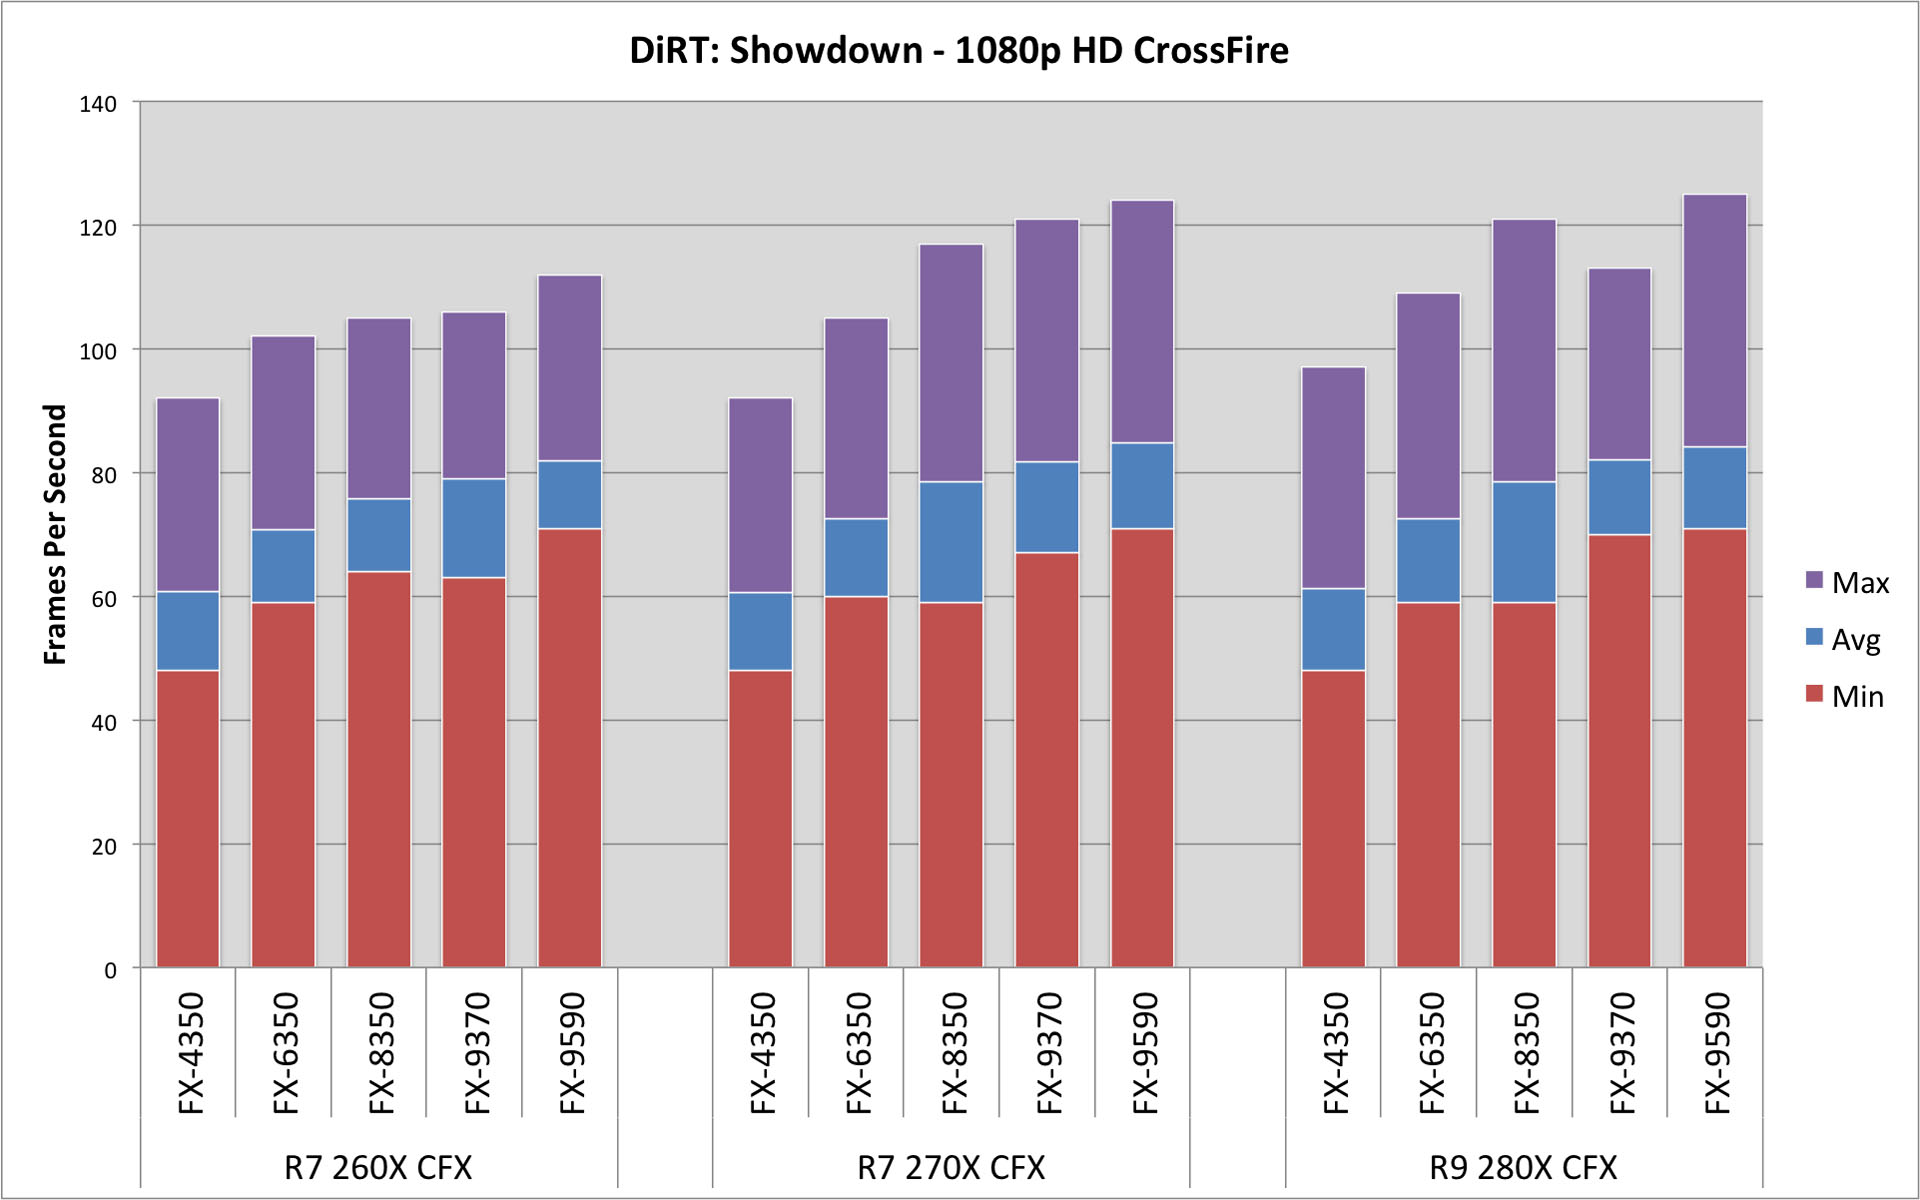
1080p Widescreen
| DiRT: Showdown - 1080p HD | DiRT: Showdown - 1080p HD CrossFire | |||||||||||||||||||||||||||
| R7 260X | R9 270X | R9 280X | R9 290 | R7 260X CFX | R9 270X CFX | R9 280X CFX | ||||||||||||||||||||||
| Min | Avg | Max | Min | Avg | Max | Min | Avg | Max | Min | Avg | Max | Min | Avg | Max | Min | Avg | Max | Min | Avg | Max | ||||||||
| AMD FX-9590 | 39 | 46.1 | 60 | 53 | 63.2 | 80 | 64 | 76.8 | 96 | 72 | 85.4 | 111 | 71 | 81.9 | 112 | 71 | 84.8 | 124 | 71 | 84.2 | 125 | |||||||
| AMD FX-9370 | 38 | 45.6 | 60 | 51 | 61.0 | 80 | 63 | 77.2 | 97 | 71 | 82.2 | 113 | 63 | 79.0 | 106 | 67 | 81.8 | 121 | 70 | 82.1 | 113 | |||||||
| AMD FX-8350 | 35 | 42.7 | 59 | 47 | 56.4 | 79 | 61 | 73.6 | 99 | 69 | 79.9 | 113 | 64 | 75.7 | 105 | 59 | 78.5 | 117 | 59 | 78.5 | 121 | |||||||
| AMD FX-6350 | 36 | 43.4 | 59 | 47 | 56.4 | 79 | 61 | 73.6 | 99 | 69 | 79.9 | 113 | 59 | 70.7 | 102 | 60 | 72.5 | 105 | 59 | 72.6 | 109 | |||||||
| AMD FX-4350 | 34 | 42.7 | 59 | 44 | 57.1 | 77 | 55 | 63.4 | 96 | 55 | 67.1 | 102 | 48 | 60.8 | 92 | 48 | 60.6 | 92 | 48 | 61.3 | 97 | |||||||
Again, as with the previous article, there is a bit of performance impact on the upper GPUs. We see improvements in averages and minimums across the CPUs, when paired with the R9 280X and especially the R9 290. These are the only instances where a better CPU makes any difference. With the FX-6350, the minimums break the 60fps barrier.

With a CrossFire configuration, there are noticeable increases with each CPU. The FX-4350 continues to be a performance inhibitor. In many instances both the averages and the minimums are above fps. DiRT: Showdown has never been a demanding game, and many of the configurations would benefit from a 120Hz monitor.
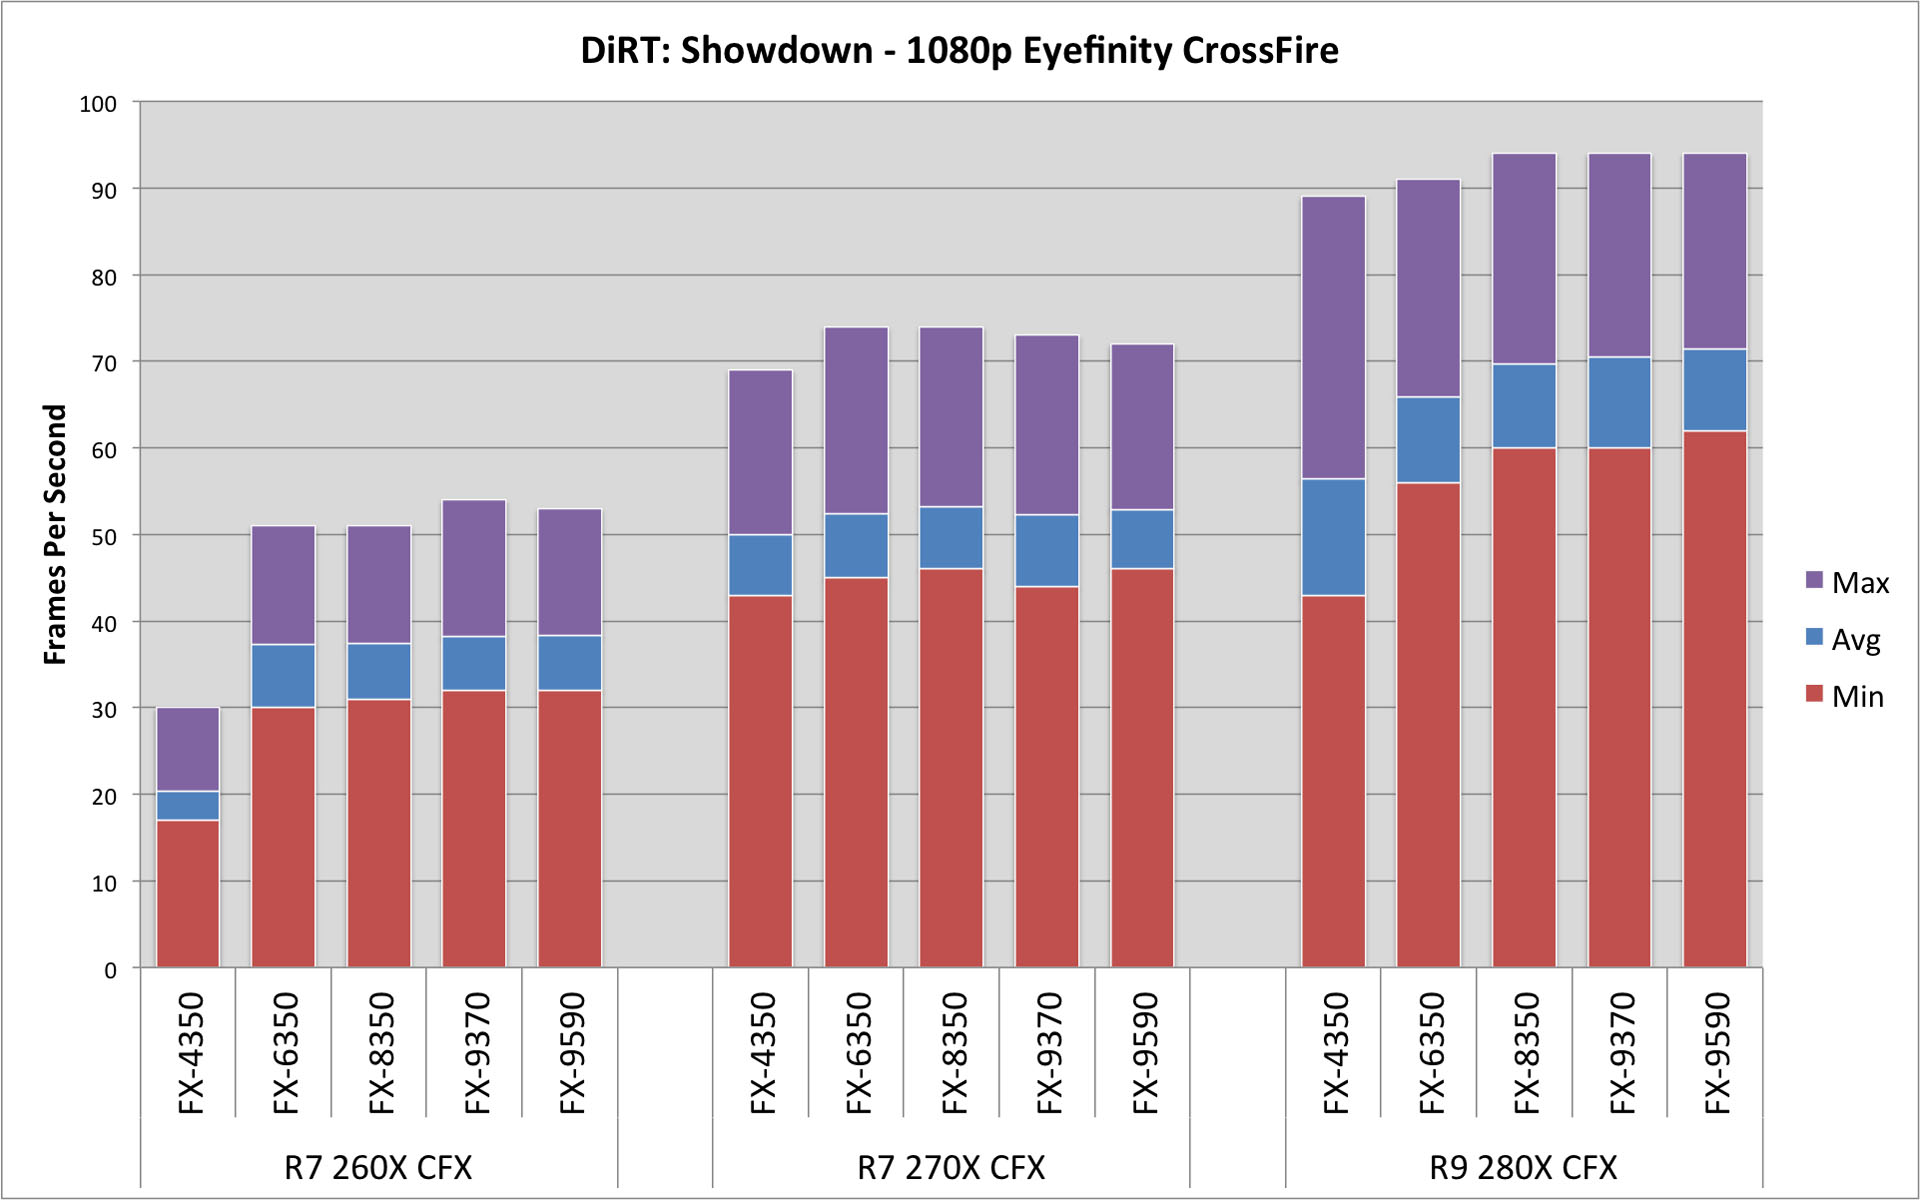
1080p Eyefinity
| DiRT: Showdown - Eyefinity | DiRT: Showdown - Eyefinity CrossFire | |||||||||||||||||||||||||||
| R7 260X | R9 270X | R9 280X | R9 290 | R7 260X CFX | R9 270X CFX | R9 280X CFX | ||||||||||||||||||||||
| Min | Avg | Max | Min | Avg | Max | Min | Avg | Max | Min | Avg | Max | Min | Avg | Max | Min | Avg | Max | Min | Avg | Max | ||||||||
| AMD FX-9590 | 17 | 20.4 | 29 | 25 | 29.5 | 41 | 34 | 39.9 | 53 | 39 | 45.3 | 61 | 32 | 38.3 | 53 | 46 | 52.9 | 72 | 62 | 71.4 | 94 | |||||||
| AMD FX-9370 | 17 | 20.5 | 29 | 26 | 29.6 | 41 | 35 | 40.3 | 53 | 39 | 44.9 | 61 | 32 | 38.2 | 54 | 44 | 52.3 | 73 | 60 | 70.5 | 94 | |||||||
| AMD FX-8350 | 16 | 20.0 | 28 | 22 | 27.4 | 39 | 32 | 39.3 | 54 | 39 | 45.7 | 62 | 31 | 37.4 | 51 | 46 | 53.2 | 74 | 60 | 69.7 | 94 | |||||||
| AMD FX-6350 | 15 | 19.9 | 28 | 23 | 27.2 | 39 | 30 | 39.0 | 54 | 39 | 45.3 | 62 | 30 | 37.3 | 51 | 45 | 52.4 | 74 | 56 | 65.9 | 91 | |||||||
| AMD FX-4350 | 16 | 19.9 | 29 | 22 | 27.5 | 39 | 31 | 38.7 | 54 | 38 | 45.2 | 62 | 17 | 20.3 | 30 | 43 | 50.0 | 69 | 43 | 56.4 | 89 | |||||||
As with the previous article, the results across each CPU is basically flat. Even looking at the minimums and maximums, the variations are within the margin of error.
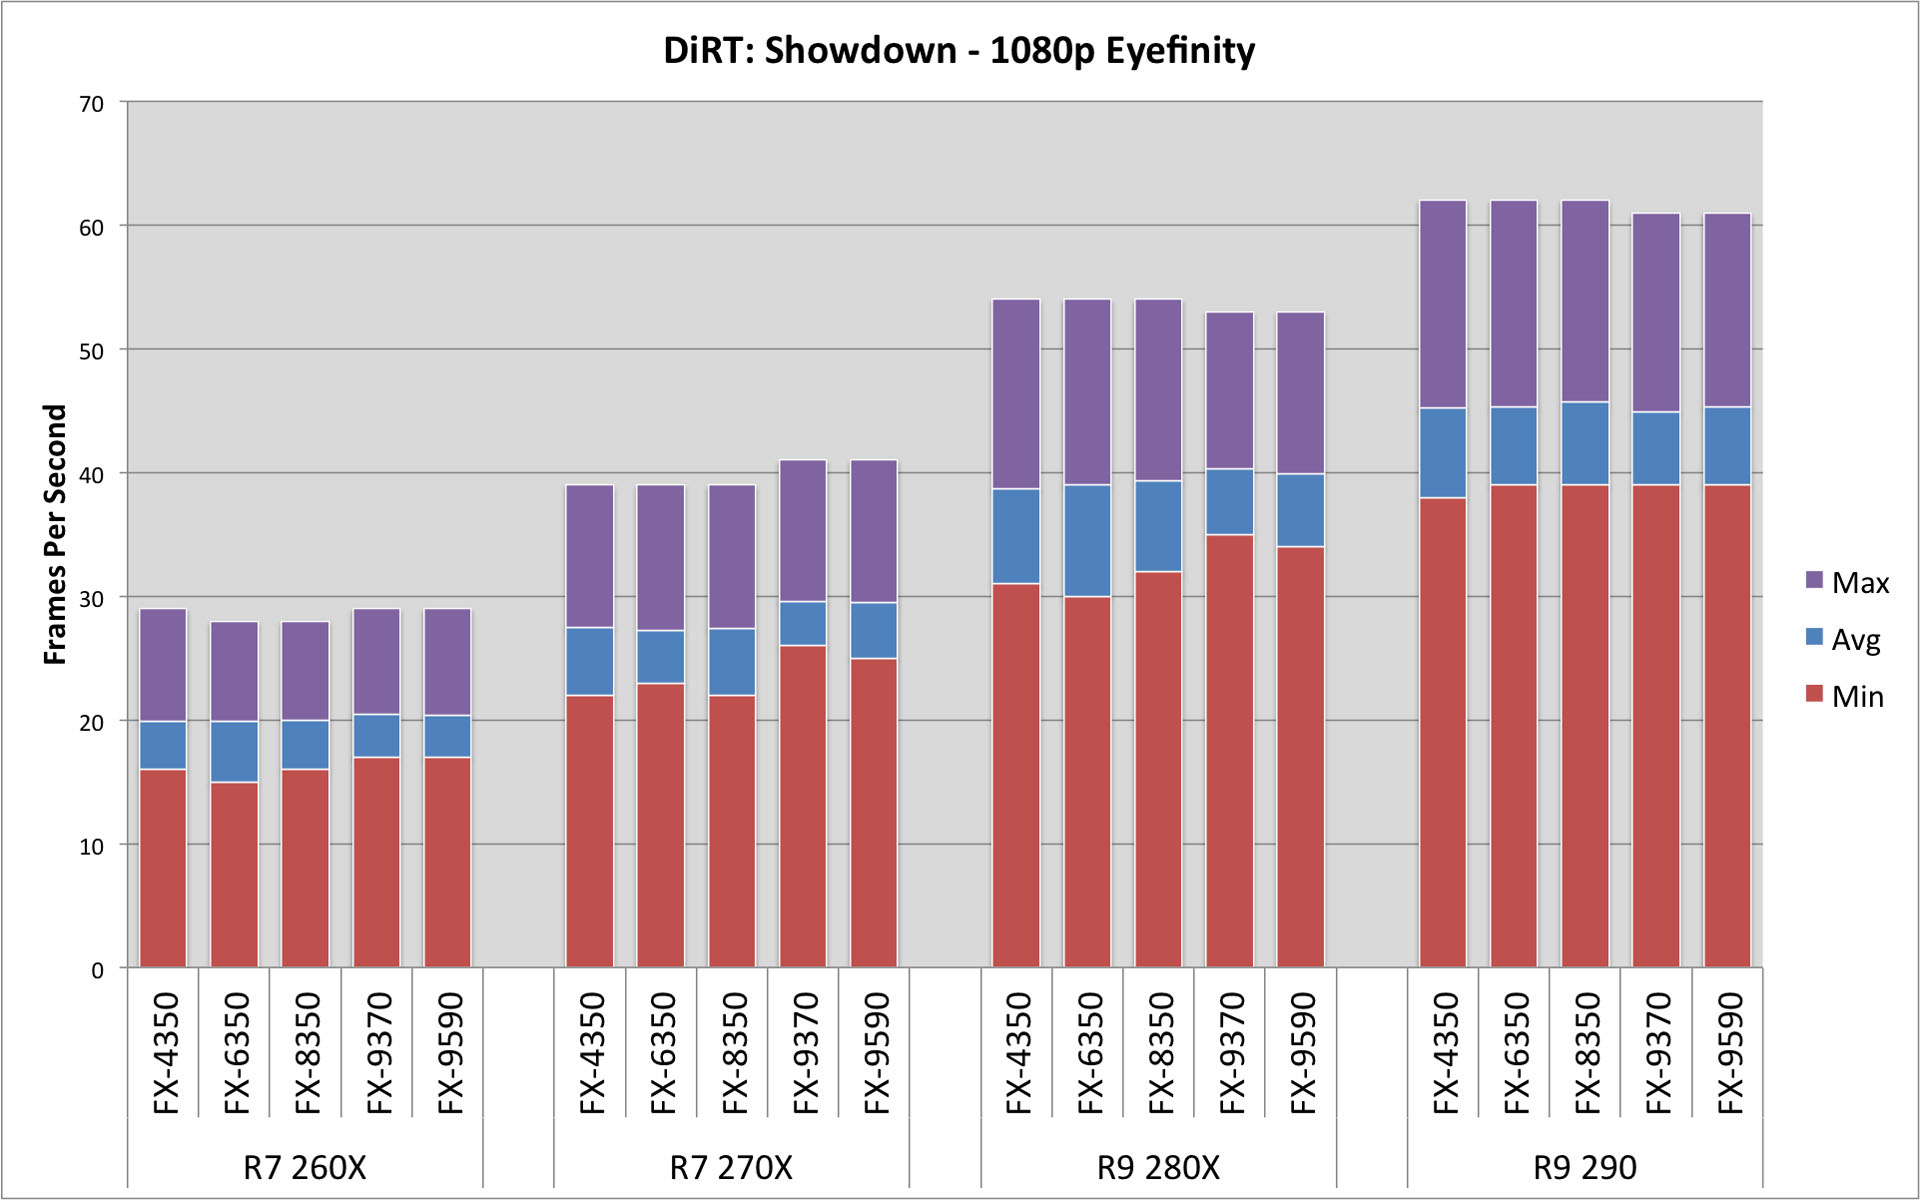
With CrossFire, we do see some performance improvements with a pair of R9 280X cards. The FX-4350 does hamper performance, especially on the R7 260X. The FX-4350 carries parity with the other CPUs with the pair of R7 270X. Even the max frame rate with the R9 280X is on par with the other CPUs. However, the minimum and average scores are much lower.
Gaming CPU Shoot-Out Redux: Multi-GPU Scaling - Unigine Valley
Unigine Valley
I have previously used the Unigine Heaven demo in GPU benchmarking. For this test I have upgraded to the Unigine Valley demo. The test was run at "High" quality, with 2X AA.
I let the benchmark load and run through a full cycle, and manually triggered the benchmark mode and then FRAPS when the images first appear on screen. I stopped FRAPS as the demo faded out.
1080p Widescreen
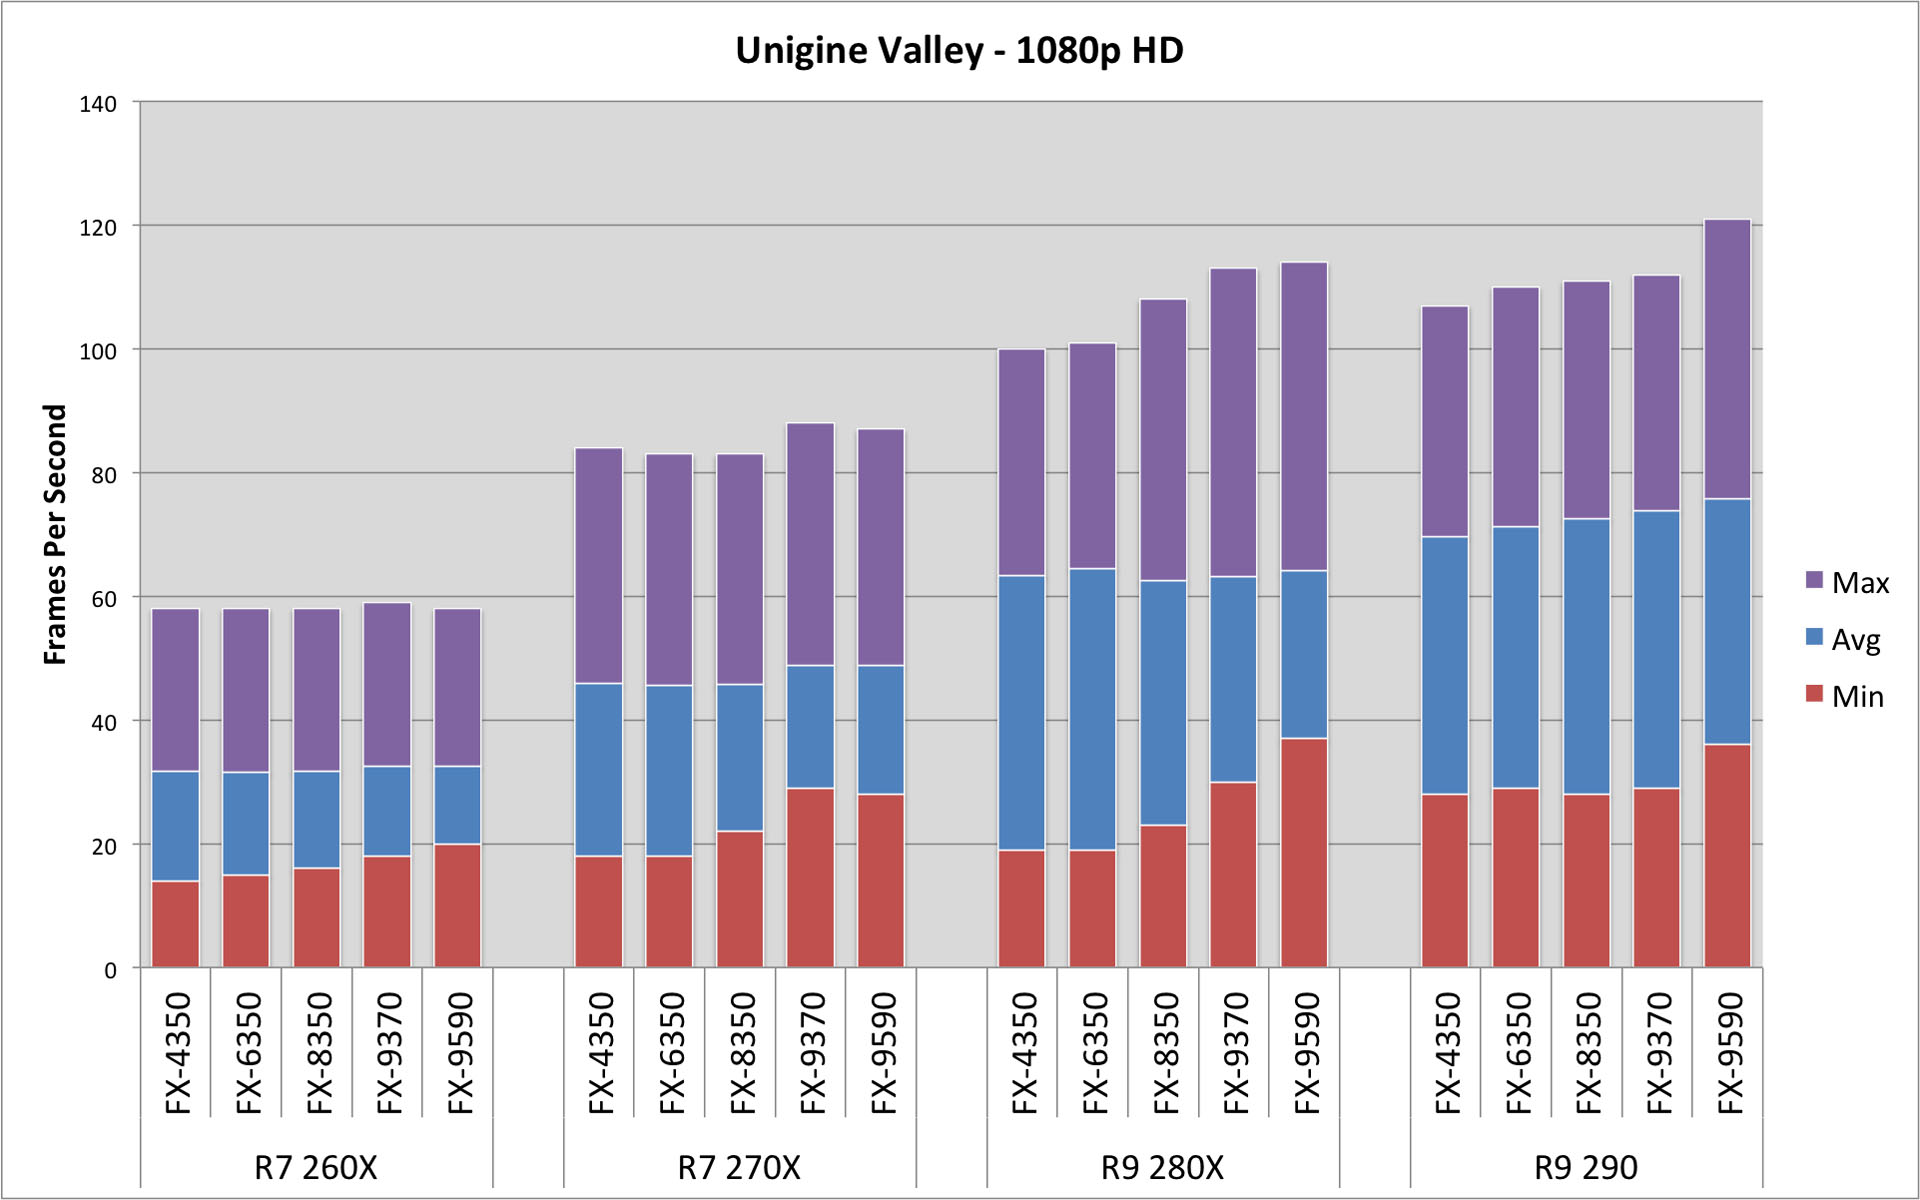
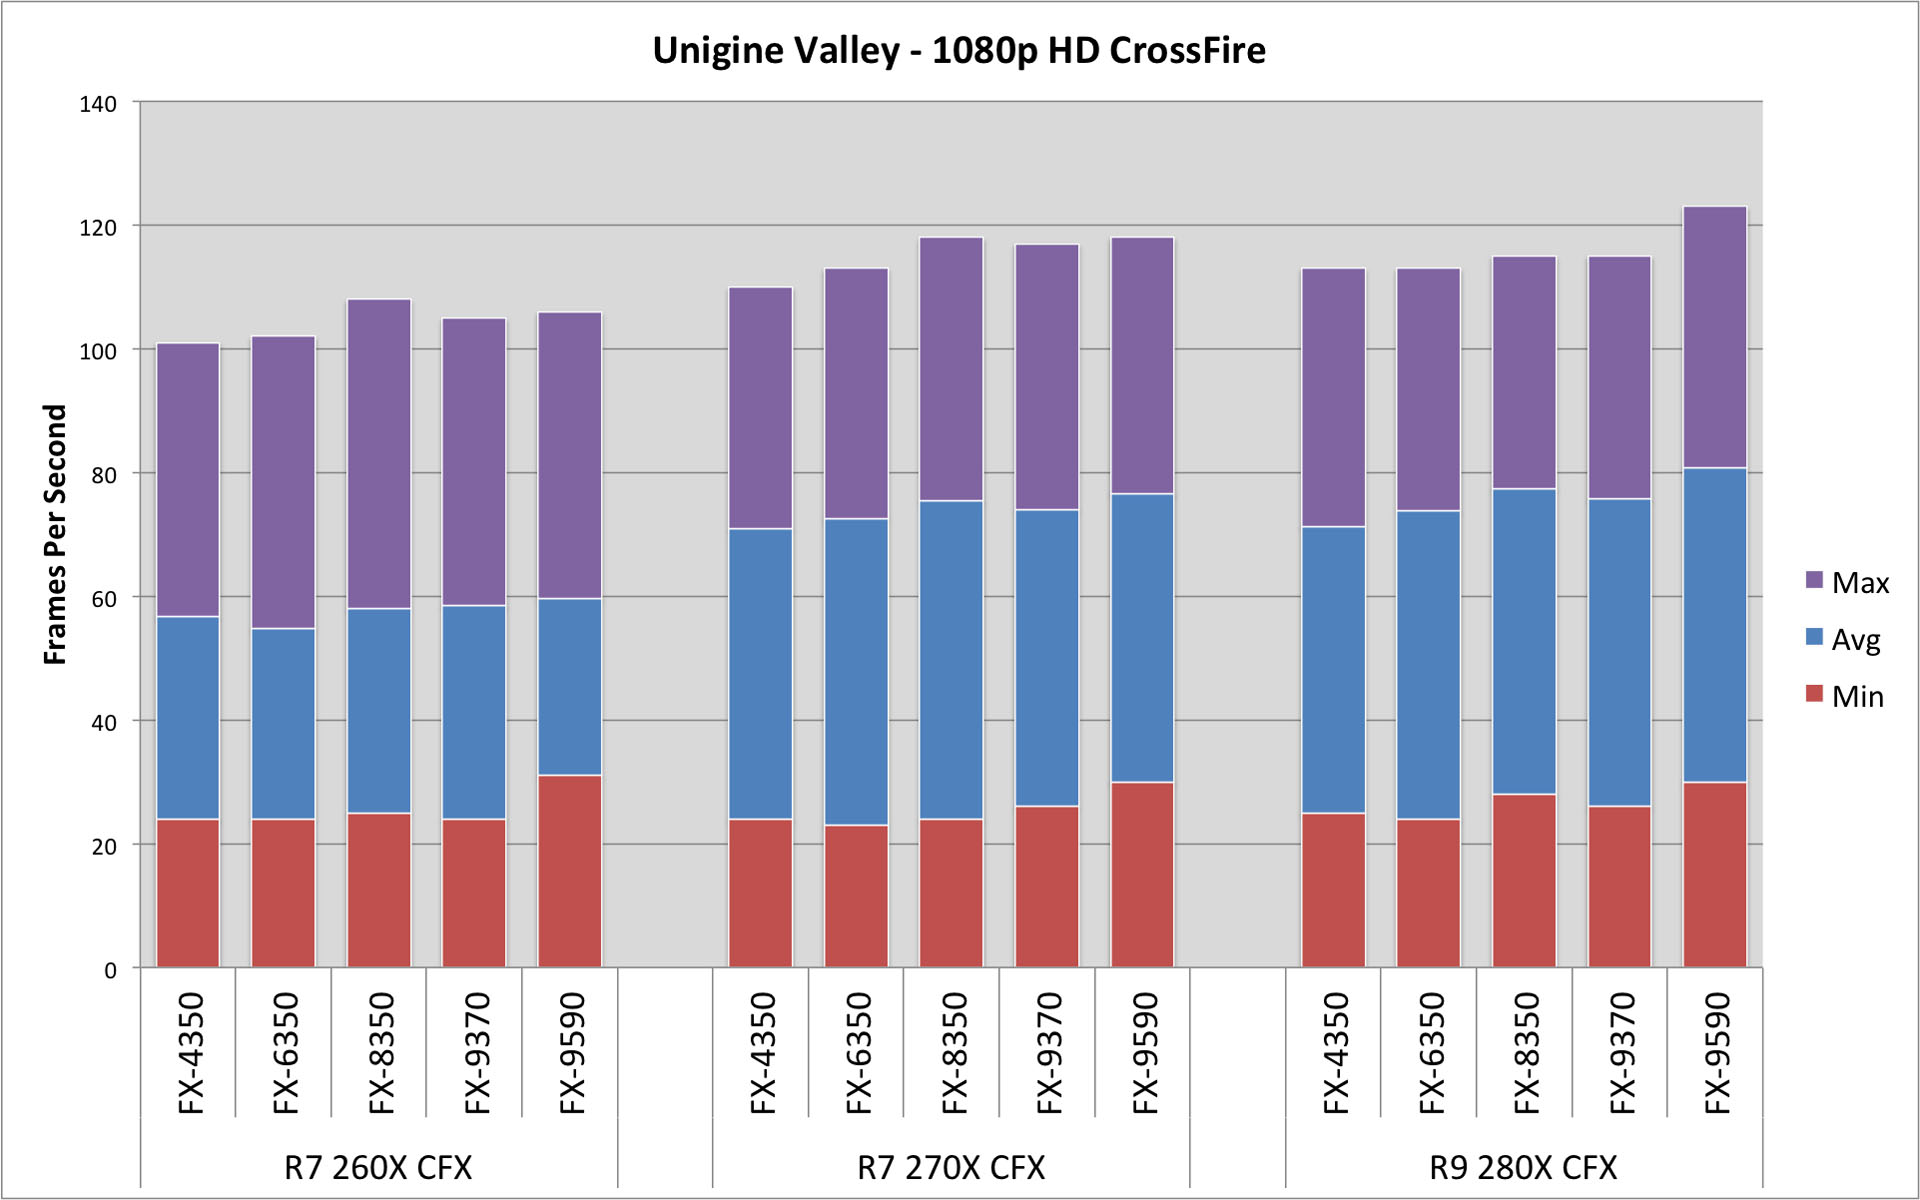
| Unigine Valley - 1080p HD | Unigine Valley - 1080p HD CrossFire | |||||||||||||||||||||||||||
| R7 260X | R9 270X | R9 280X | R9 290 | R7 260X CFX | R9 270X CFX | R9 280X CFX | ||||||||||||||||||||||
| Min | Avg | Max | Min | Avg | Max | Min | Avg | Max | Min | Avg | Max | Min | Avg | Max | Min | Avg | Max | Min | Avg | Max | ||||||||
| AMD FX-9590 | 20 | 32.5 | 58 | 38 | 48.8 | 87 | 37 | 64.1 | 114 | 36 | 76.0 | 121 | 31 | 59.6 | 106 | 30 | 76.6 | 118 | 30 | 80.7 | 123 | |||||||
| AMD FX-9370 | 18 | 32.5 | 59 | 29 | 48.8 | 88 | 30 | 63.2 | 113 | 29 | 74.0 | 112 | 24 | 58.5 | 105 | 26 | 74.0 | 117 | 26 | 75.7 | 115 | |||||||
| AMD FX-8350 | 16 | 31.7 | 58 | 22 | 45.8 | 83 | 23 | 62.5 | 108 | 28 | 73.0 | 111 | 25 | 58.0 | 108 | 24 | 75.4 | 118 | 28 | 77.4 | 115 | |||||||
| AMD FX-6350 | 15 | 31.6 | 58 | 18 | 45.6 | 83 | 19 | 64.5 | 101 | 29 | 71.0 | 110 | 24 | 54.8 | 102 | 23 | 72.5 | 113 | 24 | 73.6 | 113 | |||||||
| AMD FX-4350 | 14 | 31.7 | 58 | 18 | 45.9 | 84 | 19 | 63.3 | 100 | 28 | 70.0 | 107 | 24 | 56.7 | 101 | 24 | 71.0 | 110 | 25 | 71.3 | 113 | |||||||
We do see som improvement across the CPU line, when paired with a single R9 280X or an R9 290. There are some clear instances (the R9 280X in particular) where minimum fps showed a major improvement with a better CPU. Max fps improved as well, but the averages held constantly.
Using a pair of video cards, we see comparable performance across the board. In each bank we don't see a CPU that can unlock any untapped power of the GPU.
1080p Eyefinity
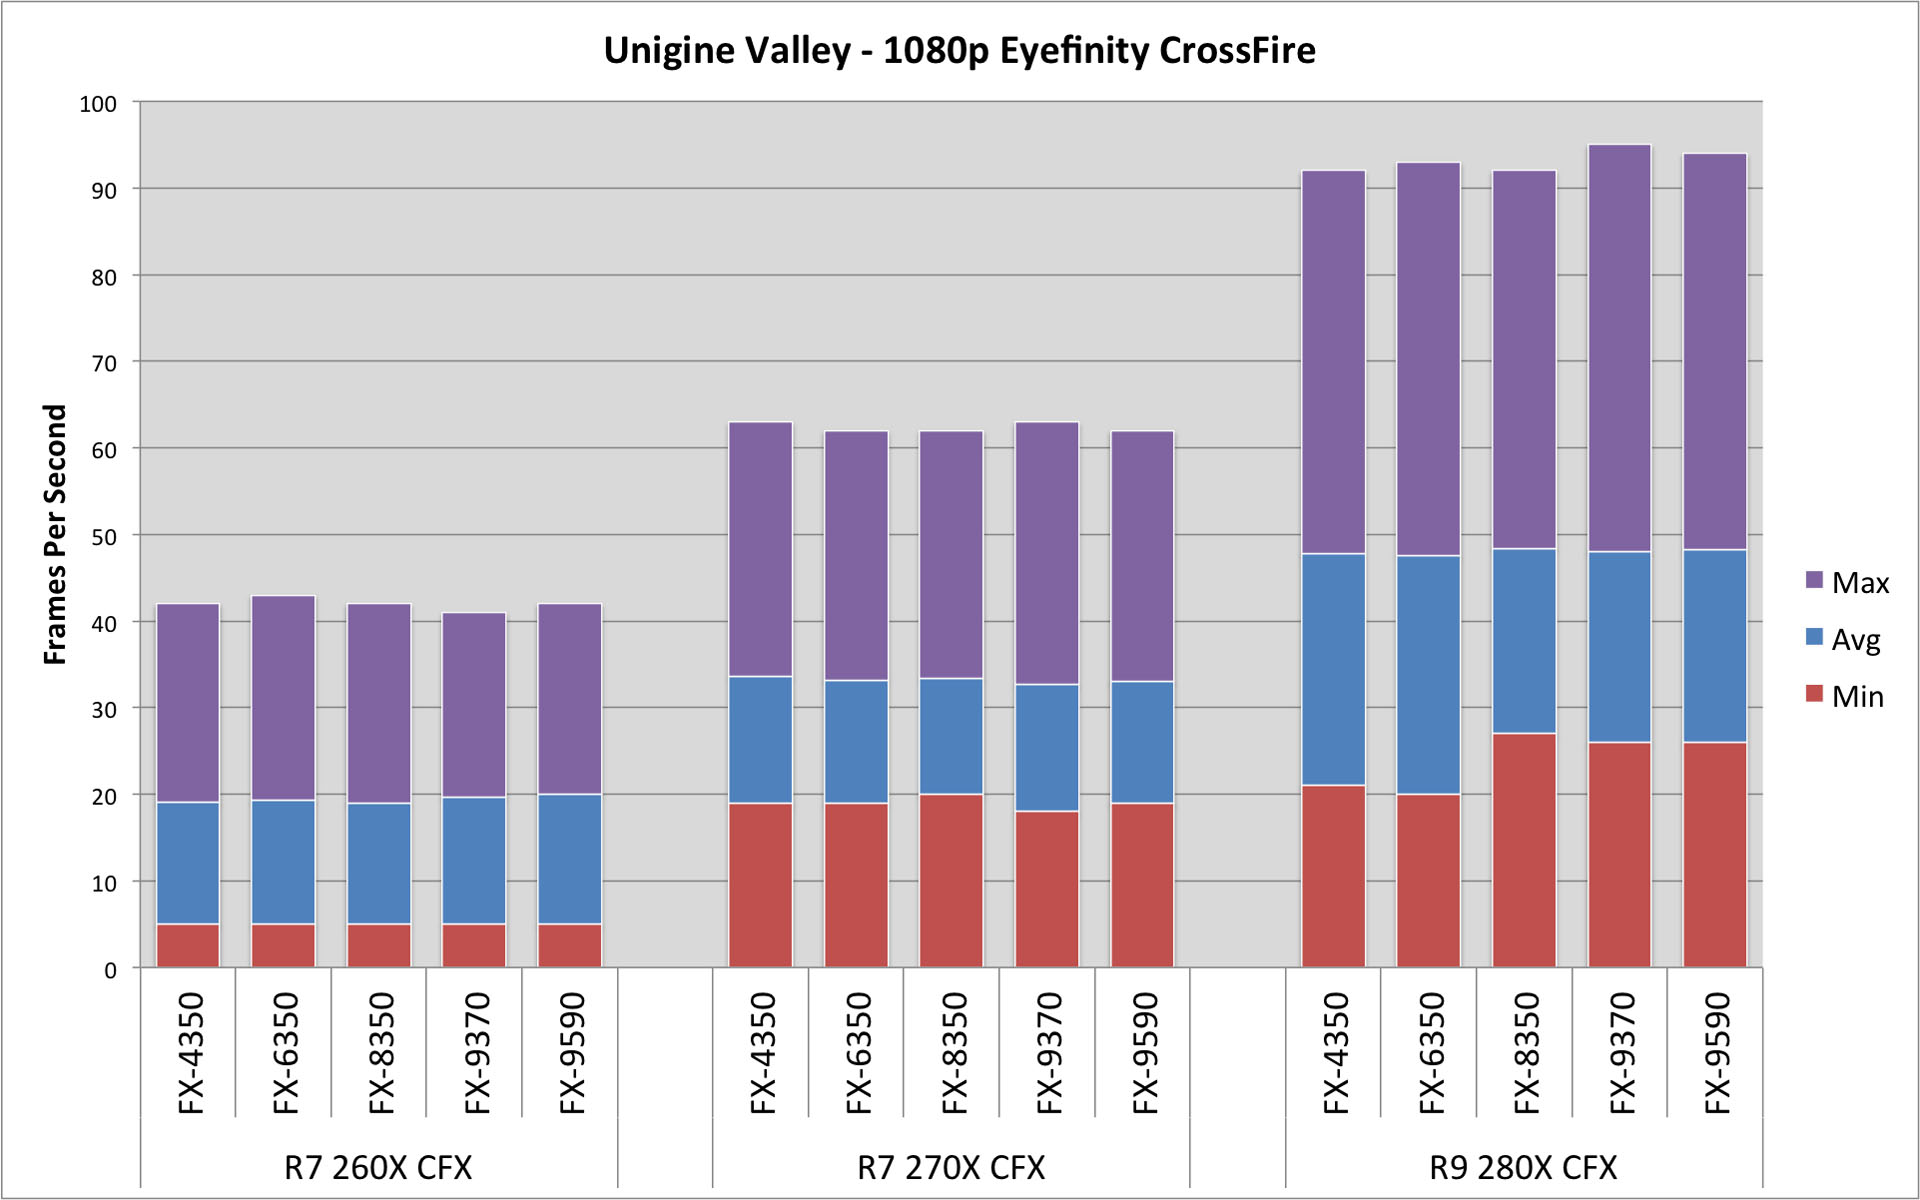
| Unigine Valley - Eyefinity | Unigine Valley - Eyefinity CrossFire | |||||||||||||||||||||||||||
| R7 260X | R9 270X | R9 280X | R9 290 | R7 260X CFX | R9 270X CFX | R9 280X CFX | ||||||||||||||||||||||
| Min | Avg | Max | Min | Avg | Max | Min | Avg | Max | Min | Avg | Max | Min | Avg | Max | Min | Avg | Max | Min | Avg | Max | ||||||||
| AMD FX-9590 | 5 | 11.5 | 22 | 11 | 18.1 | 35 | 14 | 25.5 | 50 | 18 | 31.5 | 58 | 5 | 20.0 | 42 | 19 | 33.0 | 62 | 26 | 48.2 | 94 | |||||||
| AMD FX-9370 | 4 | 11.5 | 22 | 11 | 18.1 | 33 | 15 | 25.5 | 49 | 19 | 31.4 | 58 | 5 | 19.7 | 41 | 18 | 32.7 | 63 | 26 | 48.0 | 95 | |||||||
| AMD FX-8350 | 1 | 10.2 | 24 | 7 | 16.9 | 35 | 11 | 25.3 | 52 | 16 | 31.2 | 59 | 5 | 19.0 | 42 | 20 | 33.4 | 62 | 27 | 48.4 | 92 | |||||||
| AMD FX-6350 | 2 | 10.6 | 24 | 7 | 16.9 | 35 | 11 | 25.3 | 52 | 18 | 29.6 | 55 | 5 | 19.3 | 43 | 19 | 33.2 | 62 | 20 | 47.6 | 93 | |||||||
| AMD FX-4350 | 2 | 10.7 | 24 | 7 | 16.9 | 35 | 11 | 25.3 | 152 | 18 | 31.1 | 59 | 5 | 19.1 | 42 | 19 | 33.6 | 63 | 21 | 47.8 | 92 | |||||||
With the Eyefinity trials, we actually see an instance where the top two CPUs perform slightly worse at max fps. Granted it is just 1-2 fps, but it is consistent. We do see that the higher end CPUs provide improvement for minimum fps.
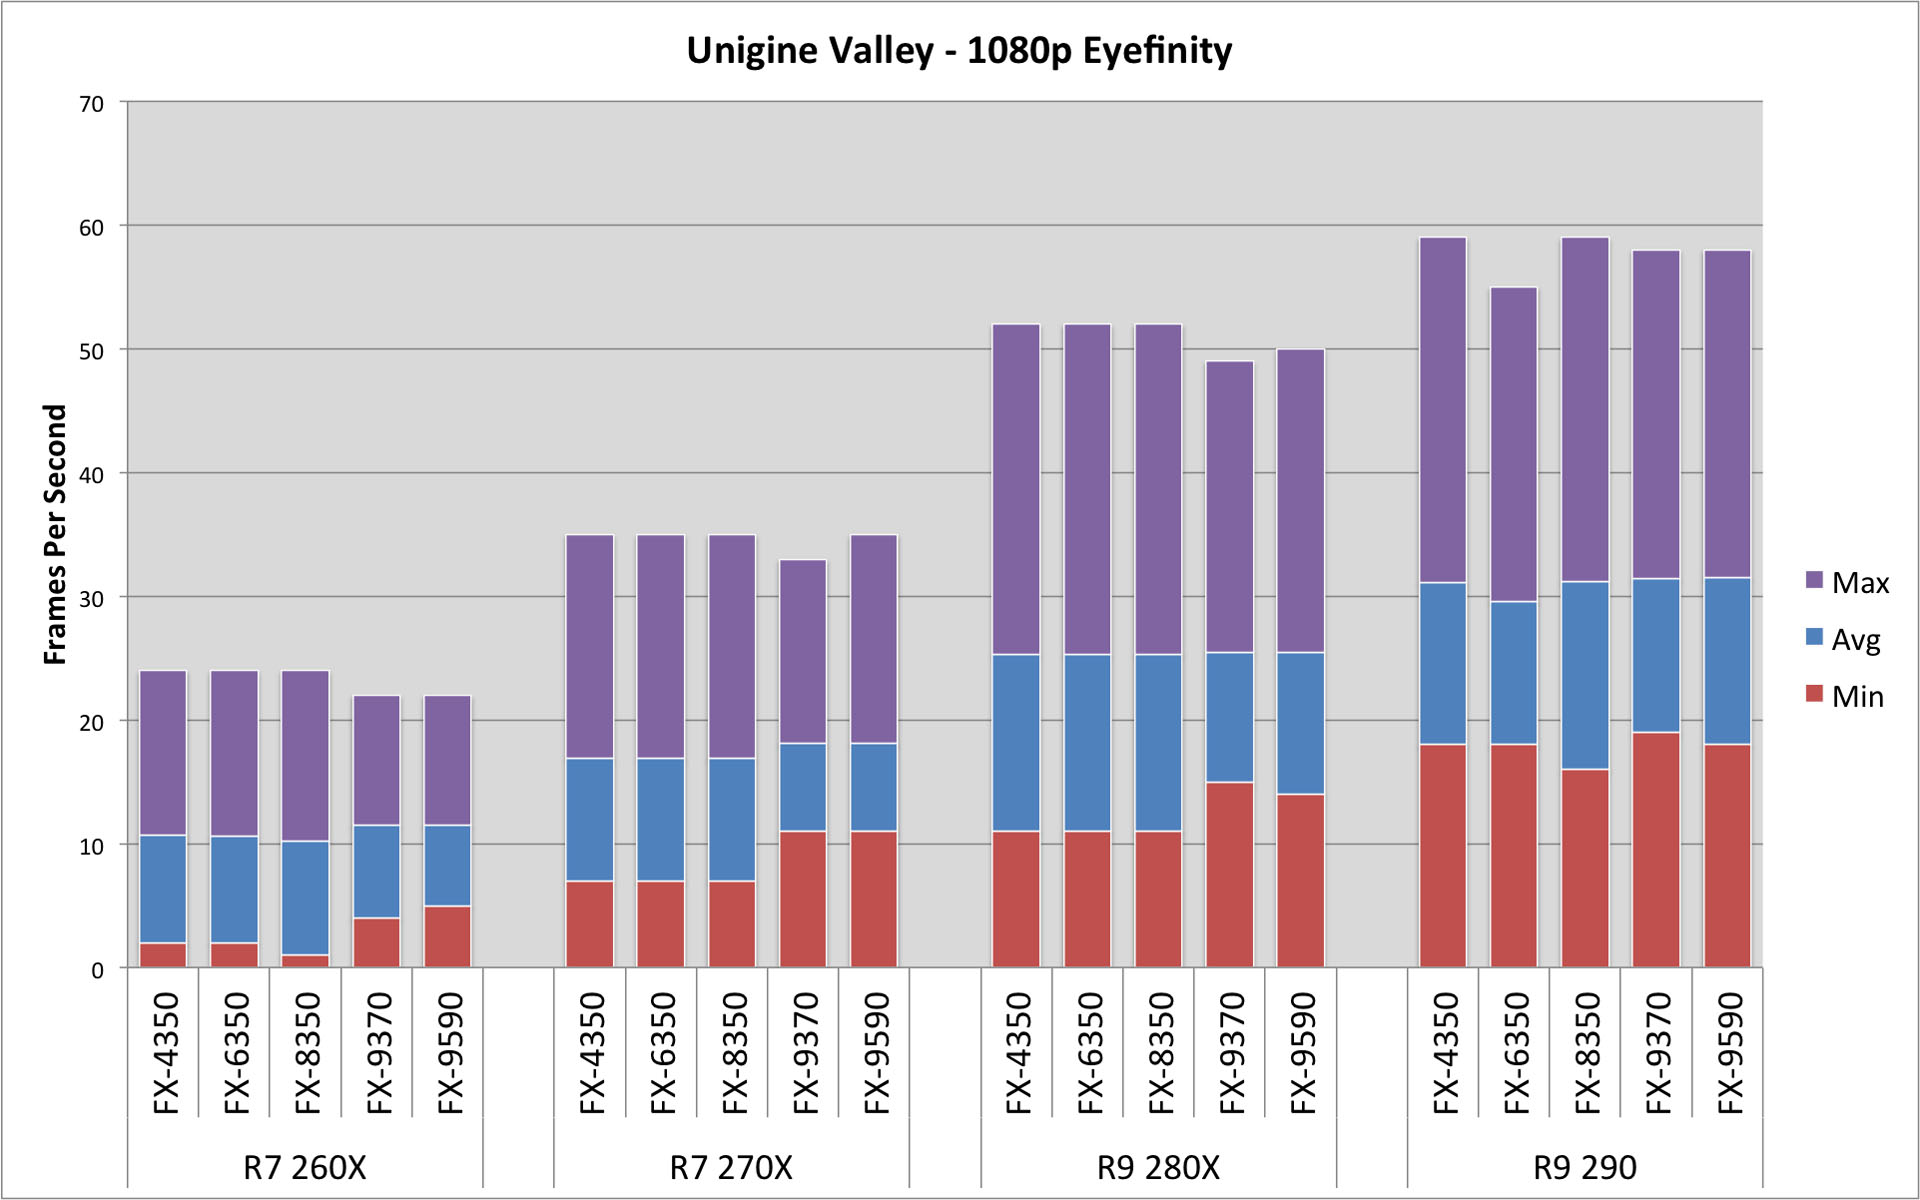
As with the single 1080p test, we see comparable performance across the board. Again, we're left with blocked groupings.
Gaming CPU Shoot-Out Redux: Multi-GPU Scaling - Conclusions
Conclusions
| Component Prices | R7 260X | R9 270X | R9 280X | R9 290 | |
| $129 | $199 | $289 | $424 | ||
| AMD FX-9590 | $229 | $358 | $428 | $518 | $653 |
| AMD FX-9370 | $209 | $338 | $408 | $498 | $633 |
| AMD FX-8350 | $179 | $308 | $378 | $468 | $603 |
| AMD FX-6350 | $139 | $268 | $338 | $428 | $563 |
| AMD FX-4350 | $99 | $228 | $298 | $388 | $523 |
With these results I am surprised again, but maybe I shouldn't be. There were some instances where a better CPU made a difference, but there was nothing earth shattering.
Even when looking at a much more powerful GPU (the R9 290) and setting up dual GPU configurations, CPU performance plays a minor role in overall system performance. Even though the CPU can help in several use cases, the GPU continues to be a major influencer.
I had expected (hoped) that a higher-end CPU would unlock or enable some untapped potential in these beefier GPU solutions. But that simply wasn't the case. My findings...
Widescreen - 1080p HD
- When paired with a single R7 260X, there is no discernible performance increase.
- With an R7 270X and above, there are some small increases in performance. In many instances the most noticeable increase are in better minimum frame rates.
- In several instances, when paired with higher-end graphics cards, the FX-4350 produces a noticeable performance hindrance. This is especially true in CrossFire configurations
- With a single GPU, the FX-6350 often performs on par with the FX-8350.
- Only with a CrossFire configuration does the FX-8350 provide real improvement.
- Performance improvements tend to flatten out above the FX-8350. There were a couple of instances where the FX-9370 and/or the FX-9590 slightly under-performed the FX-8350.
Eyefinity - 3x 1080p HD
- There are no discernible improvements on average frame rates with a better CPU, when paired with a single GPU.
- There are instances where a better CPU does give better minimum frame rates, but only when paired with the R9 290.
- The FX-4350 is often a performance hindrance for Eyefinity paired with GPUs in CrossFire.
General
- The higher-end FX-9370 and FX-9590 do not offer enough of a performance boost to justify the extra money, power draw and heat generation.
- The FX-4350 is performance hindrance to the R9 290, when powering a widescreen system. It is also a hindrance with any CrossFire usage.
- The sweet spot for single screen continues to be a mid-range processor such as the FX-6350.
- The FX-8350 does provide a performance boost in CrossFire applications.
Buying Recommendations
Intel
Looking back at the first article, and drawing parallels here, I would make similar recommendations for Intel CPUs. The Intel Core i3 may still be a good CPU for single screen gaming on single GPUs. An Intel Core i5 should serve well for dual GPU configurations. Assuming the extra cores perform in a similar manner, we would expect to see real improvements on the minimum frame rates with the Core i5. The additional cores will also help with the multi-tasking inherent in the PC environment.
While you're gaming, your machine is also running Windows, anti-virus, Steam, Steamspeak, and maybe a browser window. I never pushed my benchmarks with that much of a workload, but I think the Core i3 would start to suffer.
As with the FX-9370 and the FX-9590, I see no real reason to spend the extra money on a Core i7. And I would even expect diminishing returns on the higher-end Core i5 parts. In general, I don't see any evidence to support purchasing a CPU beyond the $175 - $200 range.
AMD
To put a wrinkle in this, AMD has just launched three new processors and lowered the costs on the existing CPU stack. My intent was to time the release of this article with the release of those parts, and the price reductions. I didn't have the time to test the new chips, but I hope to shed some light on where they slot in here.
Looking at only the parts I've tested here, I would continue to recommend an FX-6350 for a single screen, single GPU configuration. For single screen, dual GPU configurations, I would recommend the FX-8350.
For Eyefinity, I would recommend the FX-6350 for all configurations (again, only looking at the parts I tested), except CrossFire configurations R9 280X and above. The FX-4350 is a hindrance to performance and should be avoided for serious gaming. On the opposite end, the FX-9370 and FX-9590 don't offer added performance for the price increase (and more importantly the power draw and heat generation).
But, AMD released new parts...
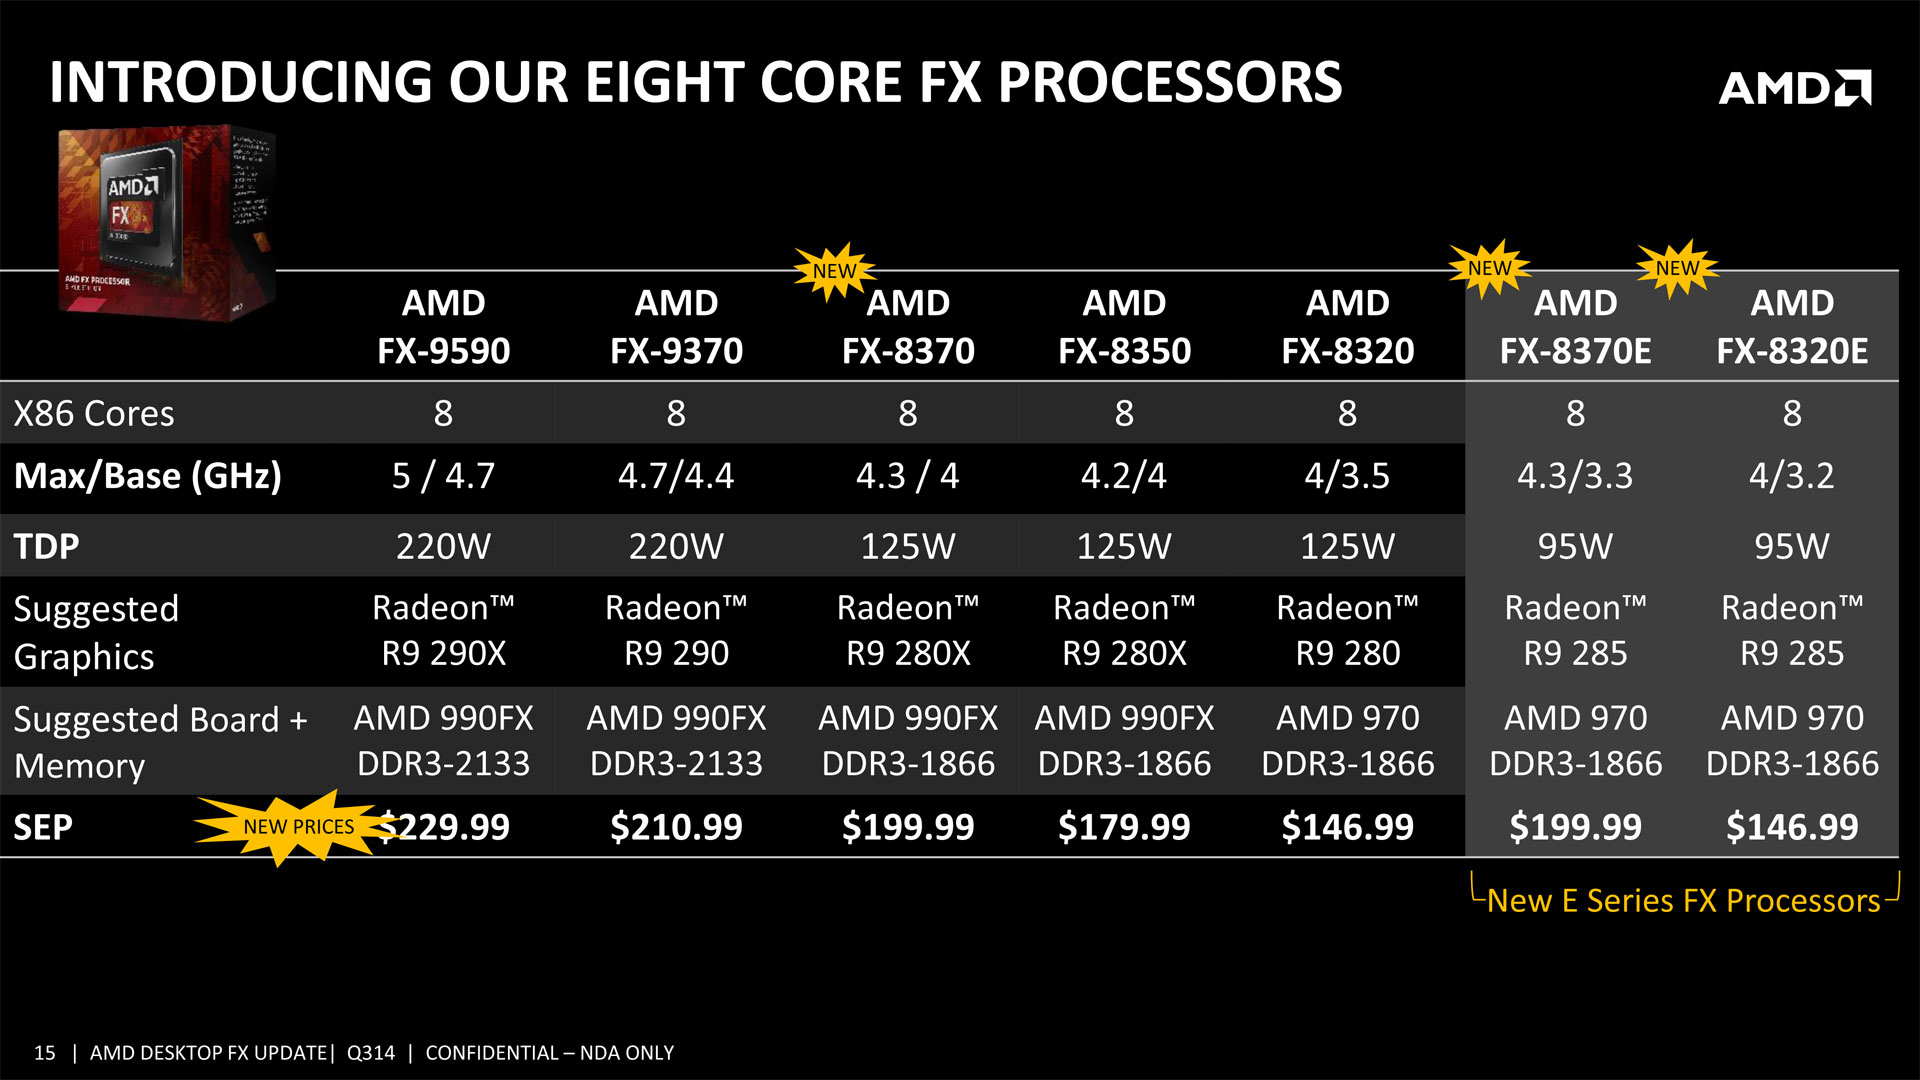
Considering the new parts and prices, the recommendations change a bit. AMD has released the new FX-8370, which slots in between the FX-8350 and the FX-9370. Given the minimal difference between those two chips, I can't recommend this as a purchase. It's only 100MHz faster than the FX-8350, and will offer no real gaming improvements. The real interesting pieces are the FX-8370E and the FX-8320E. These are 8-core chips, but run at lower base clocks. The max clock falls in line with the original version, but the lower base clock makes these 95W parts.
The base clocks on these are lower than either the FX-4350 or the FX-6350, but clocks aren't the whole story. The FX-4350 runs at a higher clock speed than the FX-6350, but it consistently performs worse. The two missing cores are the driver of the performance drop. On the other side, the FX-8350 is only 100MHz faster than the FX-6350, yet it shows better performance in many cases - specifically in minimum frame rates. The additional cores drive this improvement. In fact the FX-4350 is clocked higher than both the FX-6350 or the FX-8350, but is obviously the worst performer.
Eight cores in the FX line is where you hit the sweet spot to maintain the best minimum frame rates, and process all of the data coming from dual GPU configurations. Significant clock increases don't have the same impact of adding the cores. The FX-9370 is 400MHz faster than the FX-8350, and the FX-9590 is 700MHz faster. But neither chip offers measurable real world improvements for gaming. My recommendation would be the new FX-8320E, for both single and dual GPU configurations. It offers eight cores, and plenty of clock speed.
With these cores, not only will you get the benefits of the additional cores today, but they will pay increasing dividends in the future. AMD Mantle is a highly parallel architecture, and the full eight cores will take advantage of this feature. DX12 is following in the parallel footsteps of Mantle. While Mantle will probably never get adoption as wide as DX12, the parallel nature of DX12 will ensure eight cores have a long life.
In General
Unless you're a content creator, or spend a lot of time doing specific CPU intensive tasks (such as encoding video), I think your money is better spent elsewhere. The price range on the AMD CPUs are quite narrow, and thus the savings impact may be minimal.
For example, an FX-8370 (or FX-8370E) only costs $55 more than an FX-8320E. That $55 may get you a bigger SSD, some more RAM, a better case, a GPU with a custom cooler, or a quieter CPU fan.
But on the Intel side, there is a $50 price range within just the Core i5 parts. If you drop down from a Core i7 part, you're looking at $100+ savings. This is enough to upgrade to a better class of video card, or double your SSD. These are sizable savings. Consider the savings from an "E" class CPU, and you could buy a second GPU. This would improve your gaming performance much more than the top-end processor.
I wanted to be able to tell you that the high-end CPUs would pair perfectly with high-end GPUs (one or two). I wanted to be able to say, "here is where we find the tipping point, and performance unleashes". But we don't find one, so I can't tell you that. Higher-end GPUs will match better with higher-end CPUs, system balance and all. But buying a bigger CPU just to have it won't give a noticeably improved experience. Even on their slide deck, AMD shows that they feel you need an R9 290 to warrant an FX-9370.
In Closing
I'll close by quoting my conclusions from my first article, as I think they are still relevant - even with this new data. Or maybe more-so because of the new data.
Unless you're creating games, rendering video, compiling large amounts of code, or some other processor intensive task - you're wasting your money on a processor over $200. It comes down to whether you are consuming media, or creating it. You need the horsepower for creation - not consumption.
Even with the data, I keep finding myself wanting to type something like, "The FX-6350 is a great performer, but you may want to go ahead and spend the little extra for the faster FX-8350". The hardware paradigm shift even needs to take place with me. Given the current economic times, we all need to ensure we getting the best value for our money and not spending needlessly. And I'm hoping this article helps you do that.
Given the newly released CPUs, I'd replace FX-6350 with FX-8320E. But the sentiment is still the same - shop smart.
What's Next
Well, I think this is the last major "matrixed" article I'll be doing like this - at least until there is some whole new system architecture. And I don't mean just the regular upgrade cycles. It would need to be something groundbreaking.
I'm glad that I have the FX-9590 in my test rig. It ensures that I'm wringing every last frame out that I can (given the hardware that I have). I'm hoping to get another R9 290, and eventually an R295 X2, as well as the new R9 285. I'd like to take a handful of GPUs, and start benchmarking how major games perform in multi-monitor, 21:9 and 4k. I want to look more towards finding what GPU you need to run the settings you want, on the panels you want.